PSY 350 Lecture Notes - Lecture 11: Psy

Document Summary
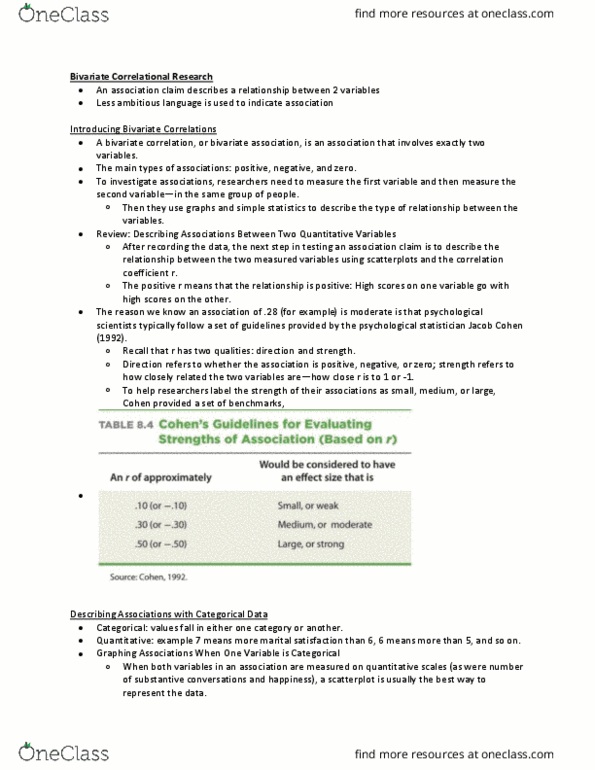
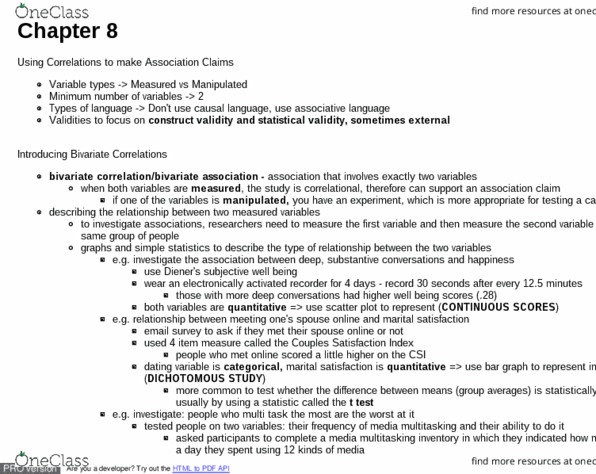
Use crosstabs to investigate associations among categorical variables, and aggregation by group to investigate associations between categorical and numeric variables. After we describe our variables individually, we can investigate how they relate to one another. The main statistic we use to describe associations among variables. And then we have more powerful statistics to test hypotheses about those relationships. But correlations don"t work so well with categorical (nominal) data, particularly when we have more than two categories or levels. There is a special correlation coefficient for ordinal data. A useful tool for visualizing associations among categorical variables. A table with one variable in rows and another in columns. The values in the table typically represent the number of observations with a particular combination of values. A good way to get a general sense of trends or patterns. When we are interested in the association between a nominal variable and an interval or ratio variable.