BIOS 1500 Lecture Notes - Lecture 7: Histogram, Box Plot, Cumulative Frequency Analysis

Document Summary
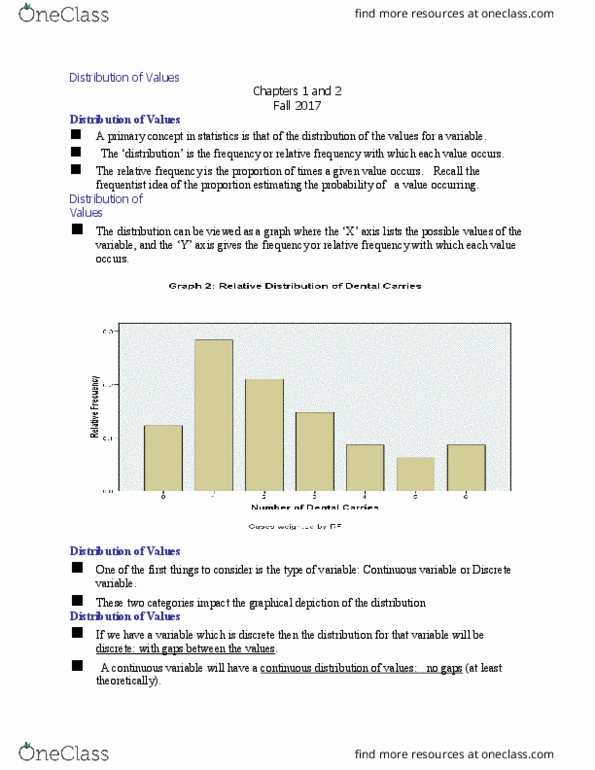
One approach we have seen to describing a distribution is that of specifying the frequency and relative frequency of each value and giving specific quantiles or percentiles of that distribution. Providing measures of central tendency, variability and shape are also used. The use of graphs to illustrate the information in a set of data is one of the most powerful of techniques for presenting a distribution of values. The ability to illustrate relationships or important characteristics of a distribution has no competitor that can come close. However, with that power to display information comes the responsibility to display it appropriately and hopefully avoiding misleading characterizations of the information. It is possible to flatten a trend or to create a trend from an essentially flat profile by changing the scale on a graph. One has to pay attention to graphs automatically created in software, as quite frequently the scale may be misleading.