PSYC 200W Lecture Notes - Lecture 10: Statistical Hypothesis Testing, Convenience Sampling, Authoritarianism

28 Jun 2018
School
Department
Course
Professor

Correlational research is used to describe relationship between two or more variables
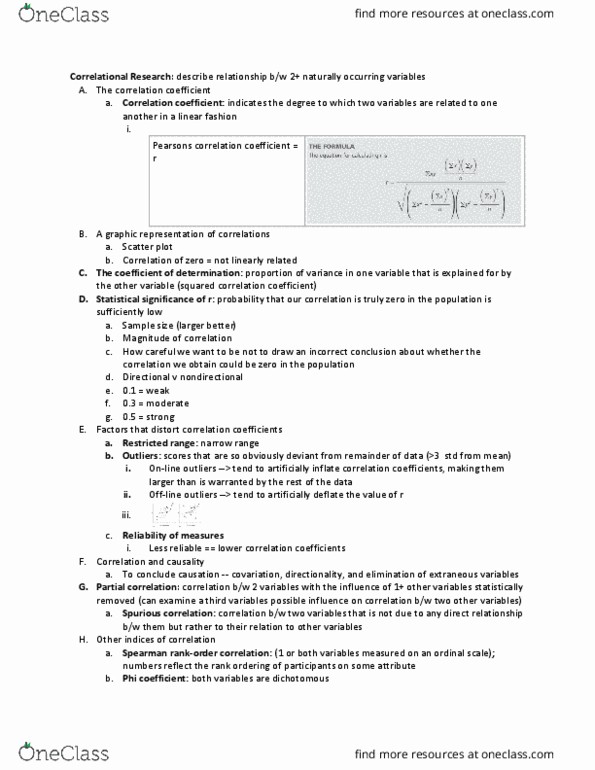
Pearson Correlation Coefficient - r
Indicates extent of linear relationship between 2 quantitative variables
Number tells us the strength of correlation
Sign tells us the direction of the correlation
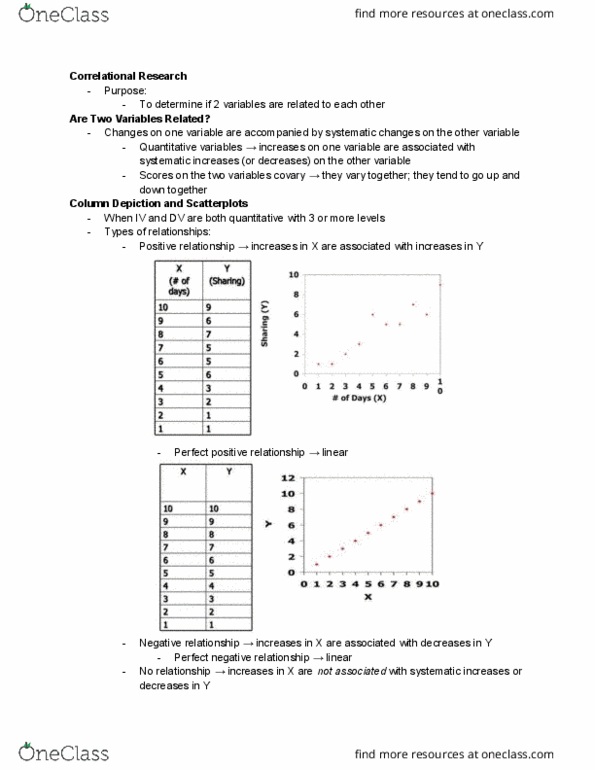
Scatterplots - handy way to visualize r
Positive correlation would go from lower left to upper right
Negative correlation would go from higher left to lower right
No relation would show no specific pattern
-> a score 0 correlation might be related in a curvilinear fashion - such as arousal and performance -
people perform best under moderate arousal
Coefficient of determination (r2)
Proportion of variance in X that's systematically related to Y --> effect size
oSystematic variance is total variability related to the variables the researcher is
investigating
oError variance is the portion of total variance that is unrelated to the variables under
investigation
16% of variance in fat intake is systematically related to weight
Done by squaring the variance
This is useful because we can directly compare strengths of associations
It is possible to get a non-zero r in our sample even if the correlation is 0 in the population
Statistical significance is when a correlation coefficient calculated on a sample has very low probability
of being zero in the population
Factors that influence the statistical significance of correlations and describe their influence
1. Sample size (n) - the larger the n is, the more likely r will be significant
2. Magnitude - r - the larger obtained value of r is, the more confident we are that r does
not = 0 in the population (ie. Theres actually a relation)
3. P-value - lower p = more careful/sure we're not making type 1 error, r has to be larger to
convince us that it is not due to chance
Factors that distort correlation coefficients:
Pearson correlation looks at linear relationship but sometimes, we have curvilinear relationship
Restricted range narrows the window of correlation to a smaller range and can lead to wrong
correlations
Outliers -
oonline - outliers that follow the same pattern as other scores but are extreme on both
variable x and y - inflates the correlation and makes it larger than real
ooffline - deflate the value of r and make it smaller than indicated by data
oDeal with outliers by either excluding them or reducing them to the value of being 3 SDs
away from mean
Reliability - lower reliability of measure lowers the correlation coefficient we obtain
Correlation =/ Causation
find more resources at oneclass.com
find more resources at oneclass.com
Document Summary
Correlational research is used to describe relationship between two or more variables. Indicates extent of linear relationship between 2 quantitative variables. Number tells us the strength of correlation. Sign tells us the direction of the correlation. Positive correlation would go from lower left to upper right. Negative correlation would go from higher left to lower right. No relation would show no specific pattern. > a score 0 correlation might be related in a curvilinear fashion - such as arousal and performance - people perform best under moderate arousal. Proportion of variance in x that"s systematically related to y --> effect size o. Systematic variance is total variability related to the variables the researcher is investigating o. Error variance is the portion of total variance that is unrelated to the variables under investigation. 16% of variance in fat intake is systematically related to weight. This is useful because we can directly compare strengths of associations.