PSYC 200W Lecture Notes - Lecture 14: Multivariate Analysis, Null Hypothesis, Analysis Of Covariance

28 Jun 2018
School
Department
Course
Professor

T-test
Compares 2 conditions of an IV
If conducted between-groups:
oIndependent groups/samples t-test
oEx: men vs women, flippers vs shoes
If conducted within-subjects:
oDependent groups/Paired samples t-test
oEx: comparing heart rate before and after working out
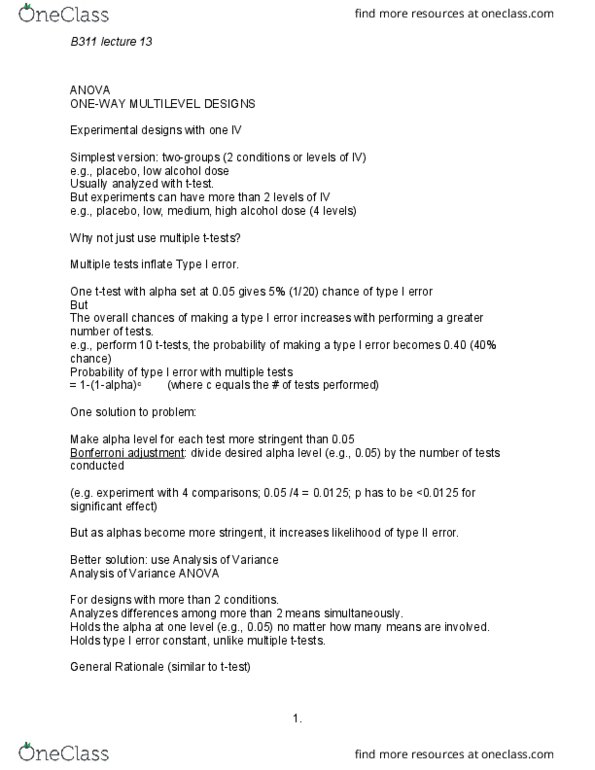
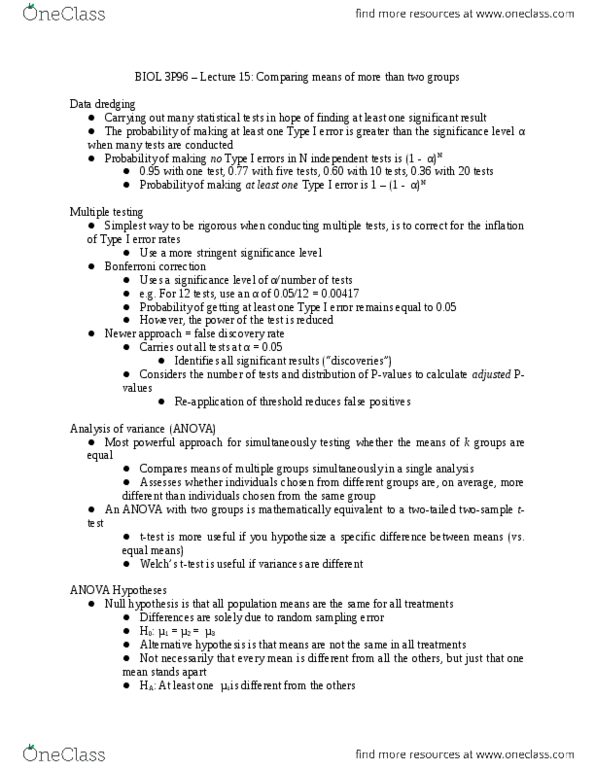
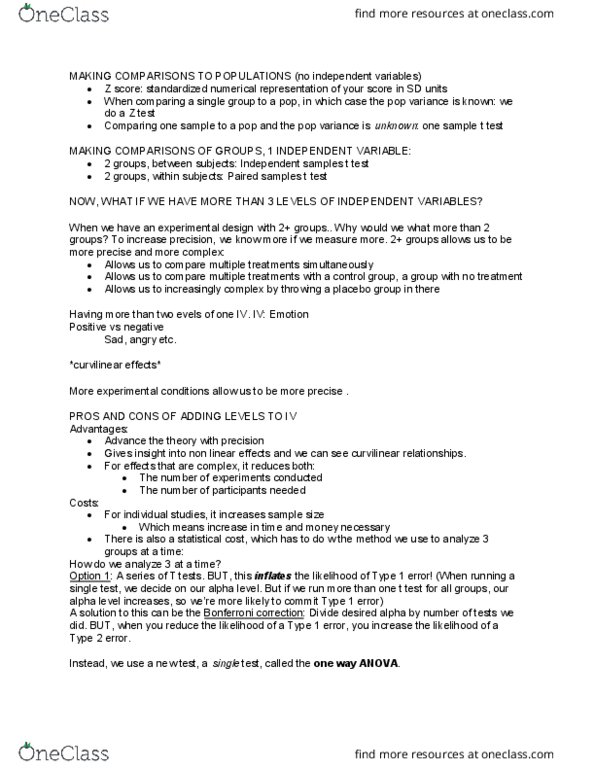
When only 1 t-test conducted - no more than 5% chance of conducting Type 1 error
Multiple statistical tests inflate Type 1 error - overall chances increase
Type 1 error can be estimated as = 1 - (1 - a)c
Bonferroni Adjustment
Control type 1 error when too many statistical analyses are conducted
Can do this by setting a more stringent alpha level than 0.05
Bonferroni adjustment - divide the alpha level by the number of tests to be carried out
o0.05/10 = 0.005
o0.05/6 = 0.0083
oThus, the chances of committing type 1 error are low again
However, it increases the chances of committing type 2 error
Only used when a few statistical tests are to be run - for more means we use ANOVA
ANOVA
ANOVA is appropriate when you have >2 conditions
Compare all condition means simultaneously while holding alpha at 0.05
Determines whether any of the group means differ from one another
If we find evidence that variance between conditions is larger than the variance within
conditions, we have evidence that the IV is causing the difference
Allows us to address 3 questions:
1. Is there a significant effect of each IV on DV?
oTo answer this, we look at "omnibus F tests"
2. Strength/importance of each IV-DV relation?
oCompute effect sizes
3. What levels of the IV differ significantly? - does the mean in group A differ from the
mean in group C
oPost hoc analyses
Omnibus F-test
Total variance = systematic variance + error variance
Systematic variance is what we are interested in and shows between-group variances (how
means differ between groups)
Error variance is variance caused by variables we are not studying and shows within-groups
variance
Even if IV has no effect on DV, we still expect and see some sort of variability in performances of
different groups -- this occurs due to error variance
find more resources at oneclass.com
find more resources at oneclass.com
Document Summary
If conducted within-subjects: dependent groups/paired samples t-test o. Ex: comparing heart rate before and after working out. When only 1 t-test conducted - no more than 5% chance of conducting type 1 error. Multiple statistical tests inflate type 1 error - overall chances increase. Type 1 error can be estimated as = 1 - (1 - a)c. Control type 1 error when too many statistical analyses are conducted. Can do this by setting a more stringent alpha level than 0. 05. Bonferroni adjustment - divide the alpha level by the number of tests to be carried out o o o. Thus, the chances of committing type 1 error are low again. However, it increases the chances of committing type 2 error. Only used when a few statistical tests are to be run - for more means we use anova. Anova is appropriate when you have >2 conditions. Compare all condition means simultaneously while holding alpha at 0. 05.