grade 8 math
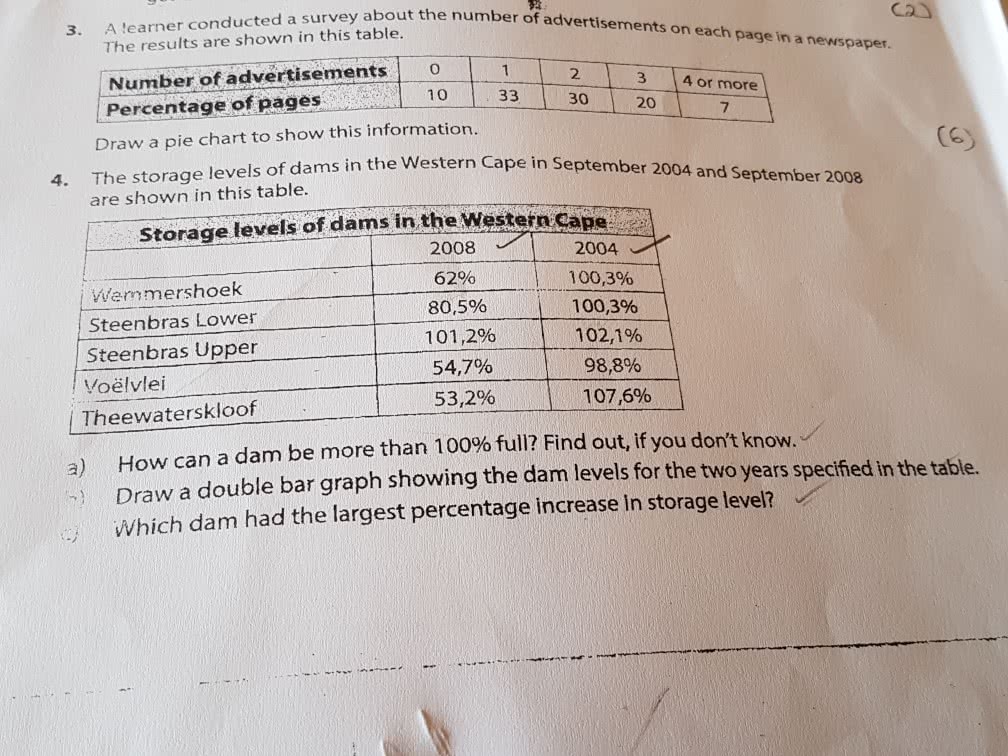
question 4 to be answered .
t the number of advertisements on each page in a newspaper. of 3. A learner conducted a survey about Ca The results are shown in this table. Number of advertisements o Percentage of pages 2 3 3 4 or more 10 30 20 7 Draw a pie chart to show this information. in the Western Cape in September 2004 and September 2008 The storage levels of dams are shown in this table. 4. Storage levels of dams in the Western Cape Warmmershoek Steenbras Lower Steenbras Upper Voelvlei Theewaterskloof 2008 62% 80,5% 101,2% 54,7% 53,2% 2004 100,396 100,3% 102,1% 98,8% 107,6% | How can a dam be more than 100% full? Find out, if you don't know. Draw a double bar graph showing the dam levels for the two years specified in the table. Which dam had the largest percentage increase In storage level? / a)