ECON 4180 Lecture 5: EC4180S16_L5

Get access


Related Documents

Related Questions
Suppose the following table reflects the domestic supply and demand for compact discs (CDs):
| Price ($) | 18 | 16 | 14 | 12 | 10 | 8 | 6 | 4 |
| Quantity supplied | 8 | 7 | 6 | 5 | 4 | 3 | 2 | 1 |
| Quantity demanded | 2 | 4 | 6 | 8 | 10 | 12 | 14 | 16 |
(a) Graph supply and demand given these market conditions.
(i) Identify the equilibrium price. $
(ii) Identify the equilibrium quantity. CDs
(b) Now suppose that foreigners enter the market, offering to sell an unlimited supply of CDs for $6 apiece. Draw a new line representing the foreign supply.
Use the graph to answer the questions below.
(i) Identify the new market price.
(ii) Domestic consumption.
(iii) Domestic production.
(c) If a tariff of $3 per CD is imposed, what will be
(i) The market price?
(ii) Domestic consumption?
(iii) Domestic production?

Plot the following combination of inflation and unemployment rates:
| Year: | 1 | 2 | 3 | 4 | 5 | 6 |
| Inflation (%): | 5 | 10 | 10 | 12 | 12 | 14 |
| Unemployment (%): | 8 | 5 | 8 | 6 | 10 | 8 |
i ) Are these data consistent with Phillips curve? ii ) Elaborate in detail what you mean by consistent.
i) If you think the data is inconsistent, what may have caused this? ii) Elaborate again what you mean by inconsistent and what are some factors contributing to that.
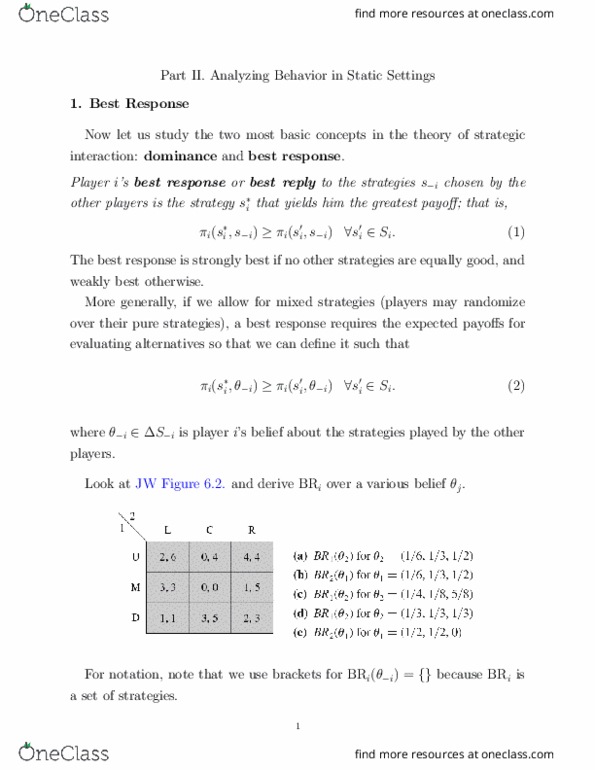
Based on your answer to part b, what recommendation can you make for the economy facing that situation?