RIU 324 Lecture Notes - Lecture 24: Spectral Density, Color Field, Autocorrelation

29 Mar 2020
School
Department
Course
Professor
Document Summary
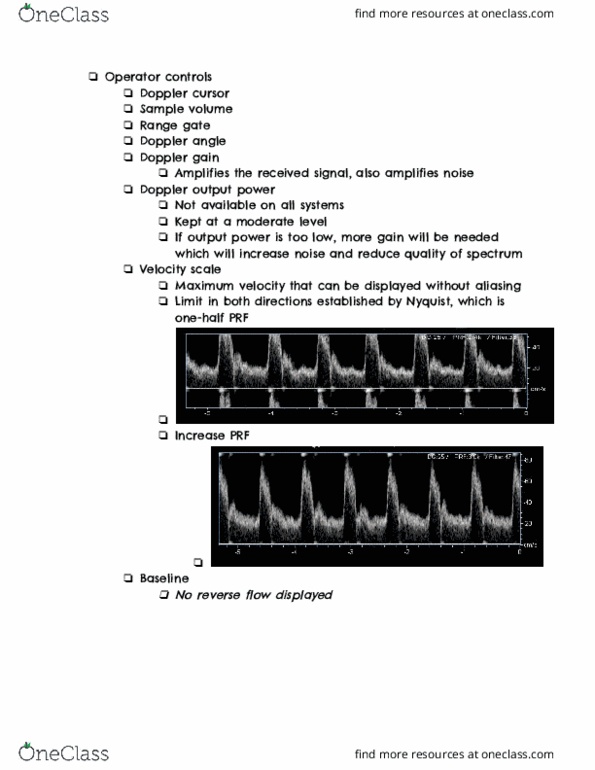
The power spectrum shows the velocity distribution at the time of sampling. The velocity distribution of rbcs in a vessel is not constant with time. In order to display the changing velocity distributions, the power spectrum for the vessel must be obtained repeatedly over time. Fft processing analyzes the series of power spectra in real time. A graphic plot of the power spectrum as a function of time is called. These variables (frequency or velocity, magnitude, and time) are shown in a two dimensional display of the doppler spectral waveform (fig. The vertical axis depicts for frequency or velocity as well as magnitude. The displacement along the vertical axis represents increased frequency or velocity. The brightness of the dot at a frequency point indicated magnitude. Each analysis of a short time segment of the complex doppler signal is presented as a single vertical line.