INTBUS 6 Lecture Notes - Lecture 2: Price Level, Aggregate Demand, Aggregate Supply

23 Oct 2020
School
Department
Course
Professor
Document Summary
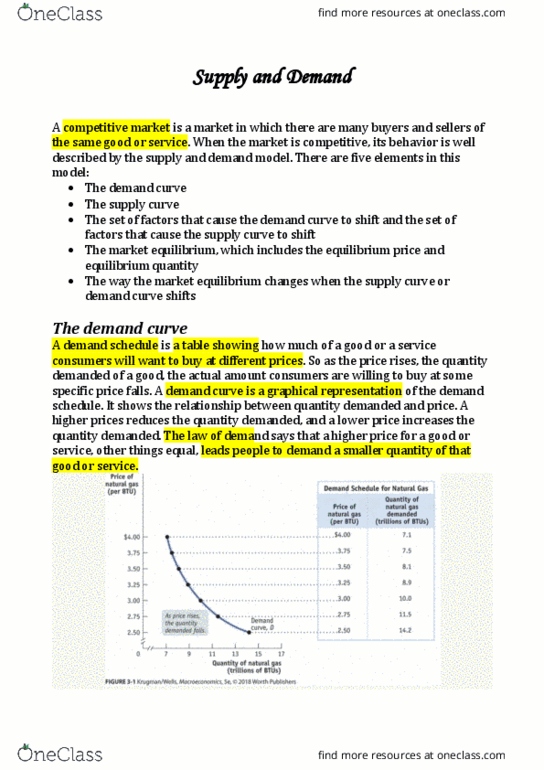
The aggregate demand curve shows the relationship between the aggregate price level and the quantity of aggregate output demanded by households, businesses, the government and the rest of the world. A higher aggregate price level, reduces the quantity of aggregate output demanded; a lower aggregate price level, increases the quantity of aggregate output demanded. The demand curve of any individual good shows how the quantity demanded depends on the price of that good, holding the prices of other goods and services constant. When we consider movements up or down the aggregate demand curve, we are considering a simultaneous change in the prices of all final goods and services. There are two main reasons of changes in the aggregate demand curve: the wealth effect and the interest rate effect of a change in the aggregate price level. An increase in the aggregate price level, reduces the purchasing power of many assets.