ECON 201 Lecture Notes - Taipei Metro, Demand Curve


1
ECON 201 – Lecture 21 – Chapter 17
*All charts and graphs based off or replicated by Joel Han in class unless stated otherwise
Oligopoly
Number of Sellers
Few
Free Entry/Exit
No (High Barriers to Entry)
Long Run Economic
Profit
Positive
Products Differentiated
Either
Market Power
Yes
Fir’s Dead Curve
Downward Sloping
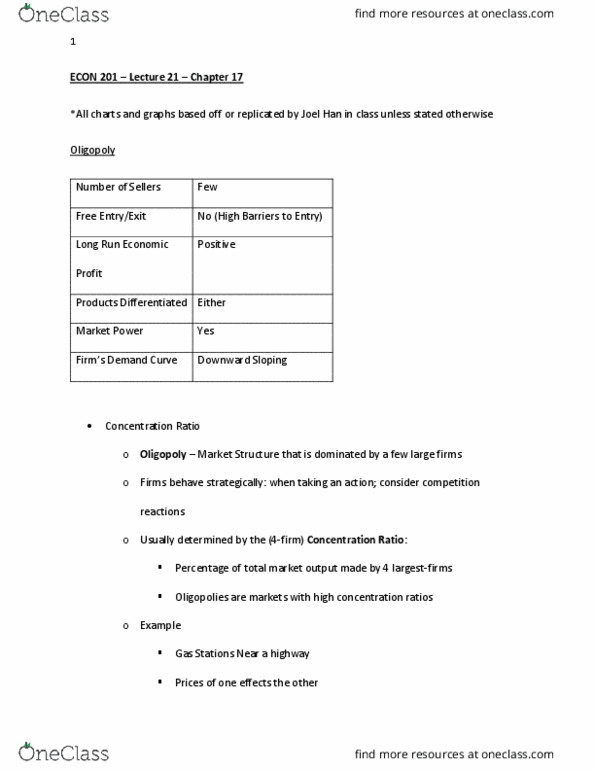
• Concentration Ratio
o Oligopoly – Market Structure that is dominated by a few large firms
o Firms behave strategically: when taking an action; consider competition
reactions
o Usually determined by the (4-firm) Concentration Ratio:
▪ Percentage of total market output made by 4 largest-firms
▪ Oligopolies are markets with high concentration ratios
o Example
▪ Gas Stations Near a highway
▪ Prices of one effects the other
find more resources at oneclass.com
find more resources at oneclass.com

2
• Strategic Behavior
o Suppose 100 people need gas each day
▪ Current prices are identical ($2.50/gallon)
▪ Shell and Pilot each get 50 buyers
o What if Shell raises to $3.00?
▪ Pilot keeps price same
▪ Pilot gets all 100 buyers (or most of them)
o If Shell lowers to $2.00?
▪ Pilot also lowers prices, both get 50 buyers
• Demand curves for Oligopolies
o Oligopolies expects that other firms will match a price cut, but not a price
increase
o What does general demand curve look like?
P
Q
Inelastic
P*
Q*
Elastic
Shell:
Pilot:
Increase $
Same $
Lower $
Lower $
find more resources at oneclass.com
find more resources at oneclass.com
Document Summary
Econ 201 lecture 21 chapter 17. *all charts and graphs based off or replicated by joel han in class unless stated otherwise. Lower : kinked demand curve, firms have little incentive to change prices, elastic demand when raising price: total revenue falling, tr = p*q, elastic: price up, q down a lot. Inelastic: price down a lot, q up a little. 3: example: internet source, use this example to explore different strategies for oligopoly firms, market demand schedule given, consider two firm oligopoly: duopoly (at&t, comcast, fc = 0, mc = (constant, profit = tr-tc. 175: calculate tc at price 5, q = 13. 5: the two firms could collude, work together to maximize total profit, act like a monopoly, need to agree how to split profits, optimal quantity = 6, assume split production equally, q per firm = 3.