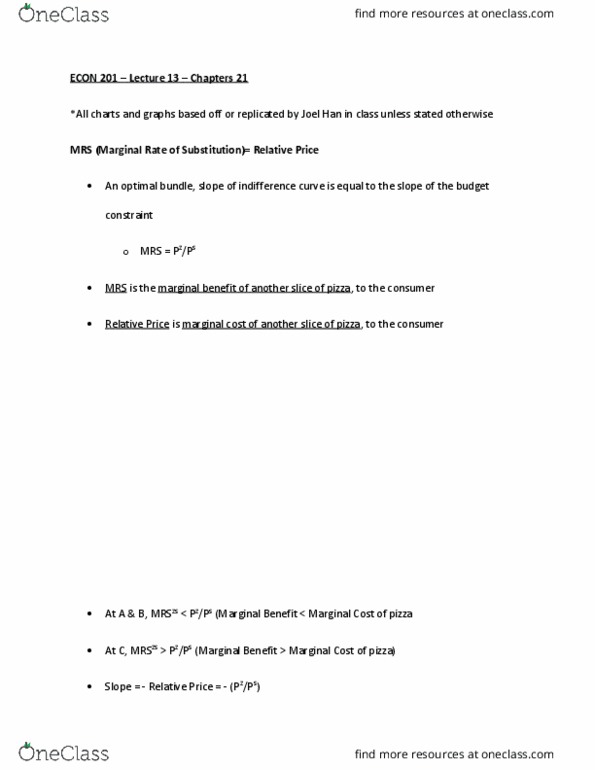
ECON 201 Lecture Notes - Budget Constraint, Indifference Curve


ECON 201 – Lecture 12 – Chapters 21
*All charts and graphs based off or replicated by Joel Han in class unless stated otherwise
Budget Constraints
• Budget Constraint – Shows the combinations of goods that a consumer can afford
• Example
o Consumer has $1200 a month to spend on pizza and soda
▪ One slice of pizza is $4
▪ One bottle of soda is $1
▪ Represented on a graph:
▪ Notice this acts just like a PPF chart, also every point on or below the line
can be afforded to the consumer
▪ 300 for pizza slices comes from the max amount of pizzas the consumer
could buy with $1200 (1200/4)
Bottles of Soda
(s)
Slices of Pizza
(z)
1200
300
Budget Constraint Graph
find more resources at oneclass.com
find more resources at oneclass.com

▪ 1200 comes from the max amount of soda the consumer could buy with
$1200 (1200/1)
o This Budget constraint can be represented by the formula
o PZZ + PSS = 1200
▪ PZ = Price of pizza, Z = Quantity of Pizza
▪ PS = Price of Soad, S = Quantity of Soda
o So in this case the formula would be: 4Z + 1S = 1200
o We then want to simplify this formula in terms of Soda: S = 1200 – 4Z
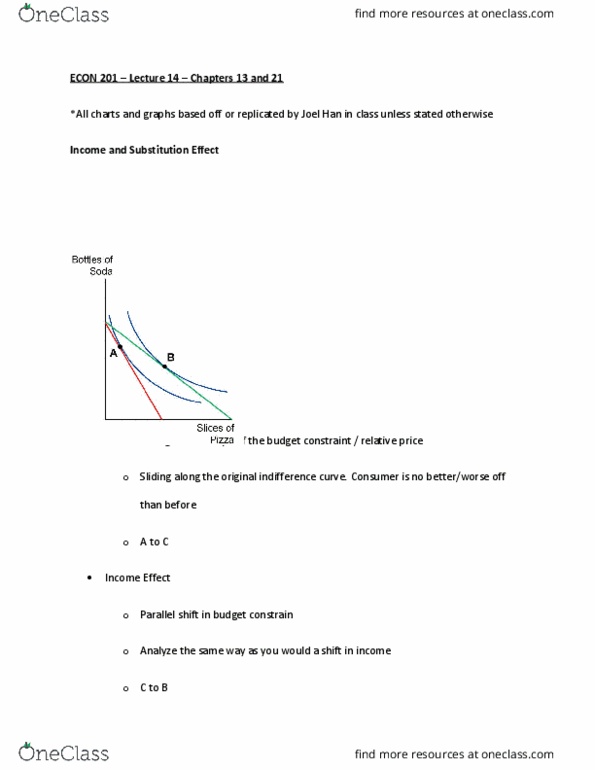
• How to find the slope of this same situation
o If given the plots:
▪ (100, 800) and (200, 400)
Bottles of Soda
(s)
Slices of Pizza
(z)
1200
300
Budget Constraint Graph
200
100
400
800
find more resources at oneclass.com
find more resources at oneclass.com

o Slope = Rise/Run = -400/100 = -4
▪ Slope of this graph is -4
o The slope of the graph is the same as the relative price (# of sodas for one more
pizza)
▪ Therefore, -4 = relative price
• What happens if the income of the consumer falls to $800?
o Green line is represented by the new income of the consumer
▪ Decrease in total amount of quantity bought (300 to 200) (1200 to 800)
o Notice the slope of the line does not change
Bottles of Soda
(s)
Slices of Pizza
(z)
1200
300
Budget Constraint Graph
200
800
find more resources at oneclass.com
find more resources at oneclass.com
Document Summary
Econ 201 lecture 12 chapters 21. *all charts and graphs based off or replicated by joel han in class unless stated otherwise. Budget constraints: budget constraint shows the combinations of goods that a consumer can afford, example, consumer has a month to spend on pizza and soda. 1200: one slice of pizza is , one bottle of soda is , represented on a graph: If given the plots: (100, 800) and (200, 400) Slices of pizza (z: red line represented by the new situation of per soda, notice the quantity of pizza is still 300 since the price of pizza stayed the same. The total amount of soda went down because the total amount of soda that decreases: what"s the (cid:374)e(cid:449) relati(cid:448)e pri(cid:272)e of this li(cid:374)e, rise/ru(cid:374) -600/300 = -2. Indifference curve a line showing combinations of goods that give consumers same level of utility: utility happiness / satisfaction.