ACMS10145 Lecture Notes - Lecture 2: Pie Chart, Categorical Variable, Frequency Distribution

26 Feb 2016
School
Department
Course
Professor
Document Summary
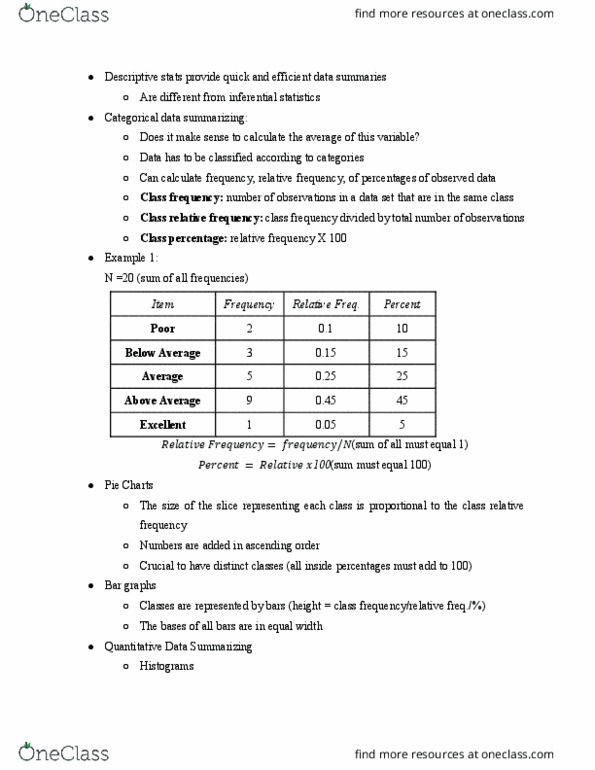
Bar chart: a graphical device for depicting categorical data that have been summarized in a frequency, relative frequency, or percent frequency distribution. Categorical data: labels or names used to identify categories of like items. Class midpoint: the value halfway between the lower and upper class limits. Crosstabulation: a tabular summary of data for two variables. The classes for one variable are represented by the rows; the classes for the other variable are represented by the columns. Cumulative percent frequency distribution: a tabular summary of quantitative data showing the percentage of data values that are less than or equal to the upper class limit of each class. Cumulative relative frequency distribution: a tabular summary of quantitative data showing the fraction or proportion of data values that are less than or equal to the upper class limit of each class.