FIN20150 Lecture Notes - Lecture 9: Standard Deviation

Document Summary
Get access


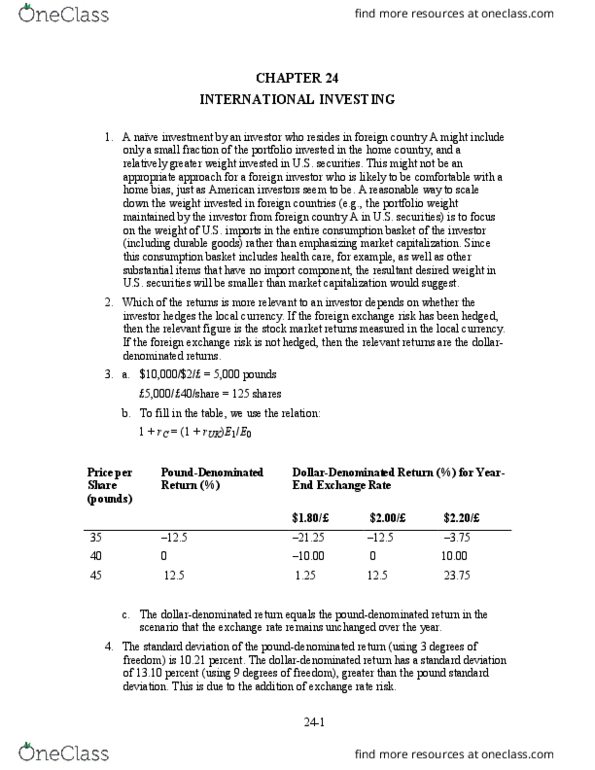
Related Documents
Related Questions
What is the taxable equivalent yield on a municipal bond with a yield to maturity of 4.5 percent for an investor in the 39 percent marginal tax bracket?
1.76 percent
4.50 percent
7.38 percent
11.54 percent
Rank the following bonds in order from lowest credit risk to highest risk all with the same time to maturity, by their yield to maturity: JM Corporate bond with yield of 12.25 percent, IB Corporate bond with yield of 4.49 percent, TC Corporate bond with yield of 8.76 percent, and B&O Corporate bond with a yield of 5.99 percent.
JM bond, TC bond, B&O bond, IB bond
IB bond, B&O bond, TC bond, JM bond
TC bond, B&O bond, IB bond, JM bond
JM bond, IB bond, B&O bond, TC bond
A 5.75 percent coupon bond with 12 years left to maturity is offered for sale at $978.83. What yield to maturity is the bond offering? (Assume interest payments are paid semi-annually and par value is $1,000.)
3.00 percent
3.09 percent
5.75 percent
6.00 percent
A client in the 28 percent marginal tax bracket is comparing a municipal bond that offers a 3.25 percent yield to maturity and a similar-risk corporate bond that offers a 4.10 percent yield. Which bond will give the client more profit after taxes?
The municipal bond.
The corporate bond.
Both give the client equal profits after taxes.
There is not enough information given to determine answer.
Portfolio Weights An investor owns $15,000 of Adobe Systems stock, $15,500 of Dow Chemical, and $17,000 of Office Depot. What are the portfolio weights of each stock?
Adobe System = 0.3333, Dow Chemical = 0.3333, Office Depot = 0.3333
Adobe System = 0.3158, Dow Chemical = 0.3263, Office Depot = 0.3579
Adobe System = 0.3263, Dow Chemical = 0.3158, Office Depot = 0.3579
Adobe System = 0.2667, Dow Chemical = 0.3333, Office Depot = 0.4000
Portfolio Return Year-to-date, Company O had earned a -7.4 percent return. During the same time period, Company V earned 9.65 percent and Company M earned 2.68 percent. If you have a portfolio made up of 20 percent Company O, 40 percent Company V, and 40 percent Company M, what is your portfolio return?
4.93%
6.41%
3.45%
19.73%
Average Return The past five monthly returns for K and Company are 4.55 percent, 4.72 percent, -.65 percent, -.15 percent, and 9.30 percent. What is the average monthly return?
3.874%
1.614%
1.481%
3.554%
Portfolio Weights If you own 270 shares of Air Line Inc at $18.95, 170 shares of BuyRite at $9.9, and 370 shares of Motor City at $45.95, what are the portfolio weights of each stock?
Air Line = .2700, BuyRite = .1700, MotorCity = .3700
Air Line = .3333, BuyRite = .3333, MotorCity = .3333
Air Line = .3333, BuyRite = .2099, MotorCity = .4568
Air Line = .2150, BuyRite = .0707, MotorCity = .7143
Portfolio Return At the beginning of the month, you owned $6,500 of Company G, $8,900 of Company S, and $2,800 of Company N. The monthly returns for Company G, Company S, and Company N were 8.15 percent, -1.59 percent, and -.14 percent. What is your portfolio return?
2.14%
6.42%
3.29%
2.13%
The standard deviation of the past five monthly returns for PG Company are 2.75 percent, -0.75 percent, 4.15 percent, 6.29 percent, and 3.84 percent. What is the standard deviation?
2.309 percent
2.581 percent
3.256 percent
3.406 percent
Rank the following three stocks by their risk-return relationship, best to worst. Rail Haul has an average return of 10 percent and standard deviation of 19 percent. The average return and standard deviation of Idol Staff are 12 percent and 22 percent; and of Poker-R-Us are 11 percent and 25 percent.
Idol Staff, Rail Haul, Poker-R-Us
Rail Haul, Idol Staff, Poker-R-Us
Idol Staff, Poker-R-Us, Rail Haul
Poker-R-Us, Rail Haul, Idol Staff
Which of the following statements is correct?
A single stock has a lot of diversifiable risk.
A single stock has more market risk than a diversified portfolio of stocks.
Bonds and stocks have a high correlation because they are both financial assets.
None of these statements is correct.
Which of the following statements is correct with regards to diversification?
Diversifying reduces the return of the portfolio.
Diversifying reduces the market risk of the portfolio.
Diversifying reduces the dollar return of the portfolio.
None of these statements is correct.
Expected Return Compute the expected return given these three economic states, their likelihoods, and the potential returns:
| Economic State | Probability | Return |
| Fast Growth | .1 | 29% |
| Slow Growth | .8 | 14% |
| Recession | .1 | -29% |
14.0%
14.3%
11.2%
17.0%
Risk Premium If the annual return on the S&P 500 Index was 14.00 percent. The annual T-bill yield during the same period was 6.50 percent. What was the market risk premium during that year?
20.50%
14.00%
7.50%
6.50%
CAPM Required Return A company has a beta of .69. If the market return is expected to be 13.9 percent and the risk-free rate is 5.95 percent, what is the company's required return?
11.44%
15.54%
17.39%
9.59%
Portfolio Beta You have a portfolio with a beta of .94. What will be the new portfolio beta if you keep 40 percent of your money in the old portfolio and 60 percent in a stock with a beta of 1.54?
1.24
1.00
1.30
2.48
Under/Over Valued Stock A manager believes his firm will earn a 17.8 percent return next year. His firm has a beta of 1.68, the expected return on the market is 15.8 percent, and the risk-free rate is 5.8 percent. Compute the return the firm should earn given its level of risk and determine whether the manager is saying the firm is under-valued or over-valued.
22.6%, under-valued
27.544%, under-valued
27.544%, over-valued
22.6%, over-valued
