BIOL 1119 Lecture 6: Lecture 6: ECG notes

19 Aug 2016
School
Department
Course
Professor
Document Summary
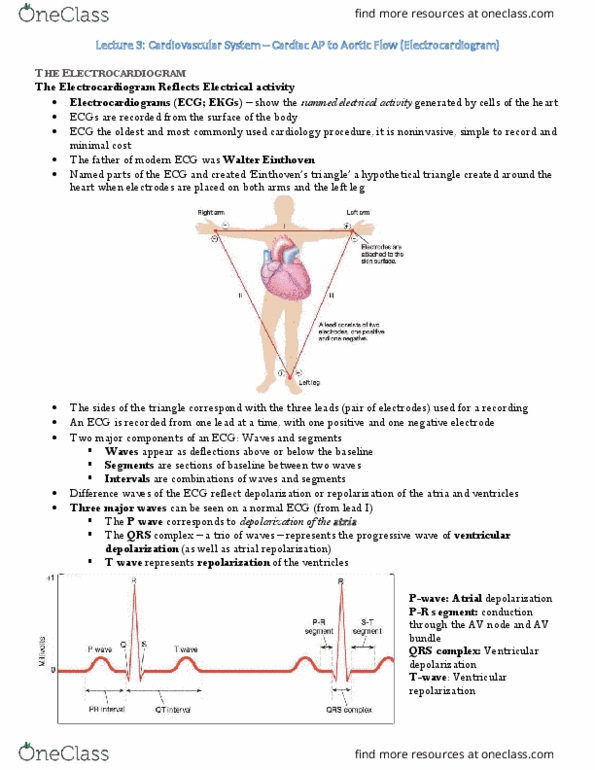
A machine called an electrocardiograph detects the heart"s electrical current and produces a graph called an electrocardiogram (ecg or ekg) The ecg is not a distant record of the change in the membrane potential across individual cardiac cells. Instead, it is a measure of the currents generated in extracellular uid by the changes occurring simultaneously in many cardiac cells. A typical ecg shows a p wave, a qrs complex, a t wave, which correspond to the regions of the heart undergoing depolarization and depolarization. P wave is the time required for impulses to travel from the sa node to the av node. Qrs is produces when the signal from the av node spreads through the ventricular myocardium and depolarizes the muscle (i. e, ventricles depolarize) The st segment is due to the plateau in the myocardial action potential during which ventricles contract. Enlarged p wave suggest atrial hypertrophy (overworked), often due to valvular insuf ciency.