STAT 101 Lecture Notes - Lecture 7: Normal Distribution, Cittern, Electronvolt

16 Mar 2019
School
Department
Course
Professor
Document Summary
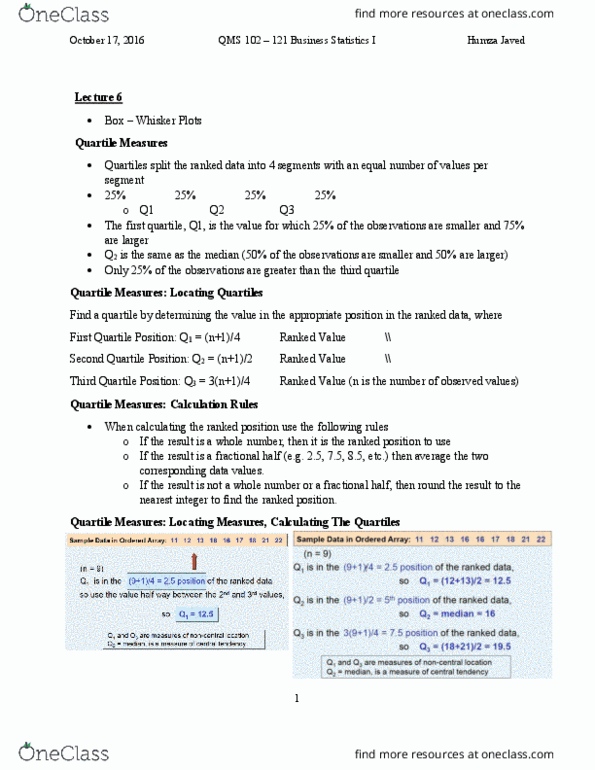
Boxplots are a way of summarizing data through visualizing the ve number summary which consists of the minimum value, rst quartile, median, third quartile, and maximum value of a data set. If a data set has no outliers, a boxplot will be made up of the following values. But, if there are outliers (those are values that fall far from the main pattern of the dataset), then a boxplot will instead be made up of the following values. M i n i m u m v a l u e (that"s not an: u t l i e r ) M a x i m u m v a l u e (that"s not an: u t l i e r ) As you can see above, outliers (if there are any) will be shown by stars or points off the main plot. If there are no outliers, you simply won"t see those points.