STAT 100 Lecture Notes - Lecture 5: Standard Deviation, Quartile, Percentile

Document Summary
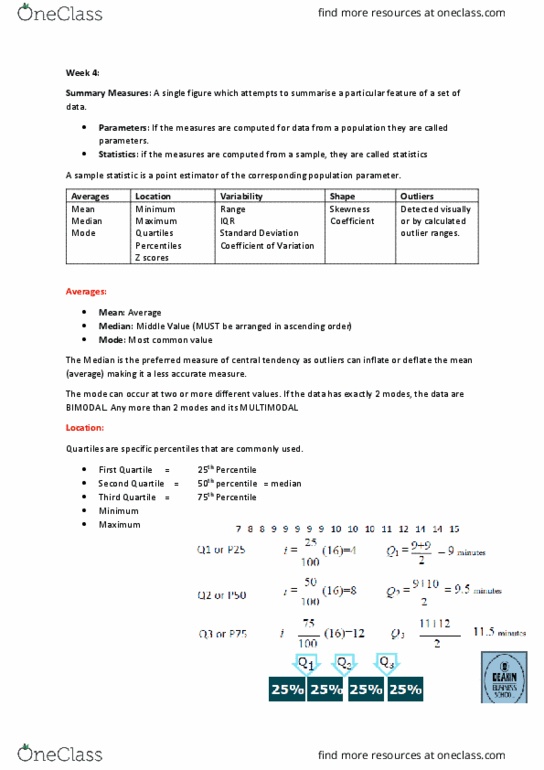
Step 1: order data (14, 23, 26, 31, 41, 44, 59, 66) Symmetrical (bell shape), skewed right (positive), skewed right (negative) Step 2: find location of the median and quartiles (median = n+1/2) Step 3: calculate value represented by the location (median is located at location 4. 5 or between. 4th = 31 5th = 41 median = halfway between 31 and 41 or 36. Calculated by: z = observed score - mean / standard deviation. Ex: if on an exam you scored a 95 which was the 90th percentile. Percentile: represents the percentage of scores at or below a specific value. Standardized score or z-score or z-value or simply z: represents the number of standard deviations an observed score is from the mean. 99. 7% chance of finding a result in a normal distribution that is within three standard deviations of the mean.