BIOSC 0370 Lecture Notes - Lecture 17: Net Reproduction Rate, Graphing Calculator, Exponential Growth

14 Apr 2016
School
Department
Course
Professor
Document Summary
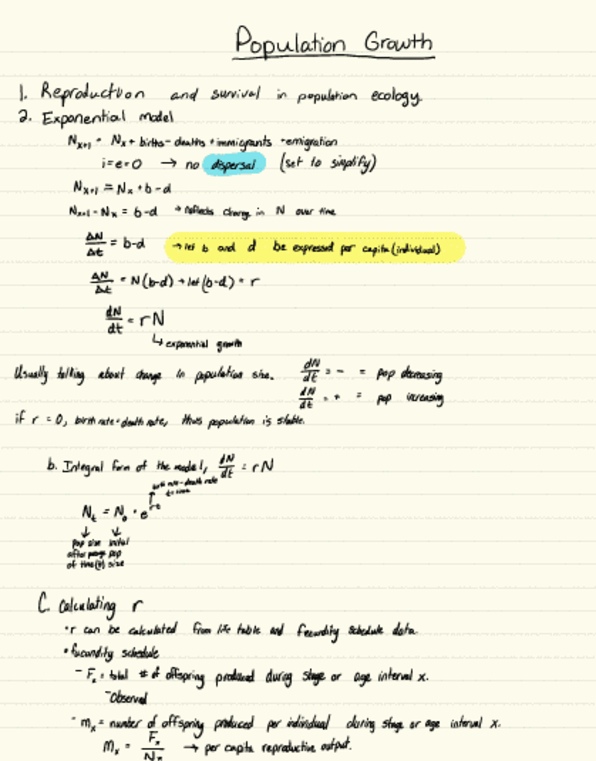
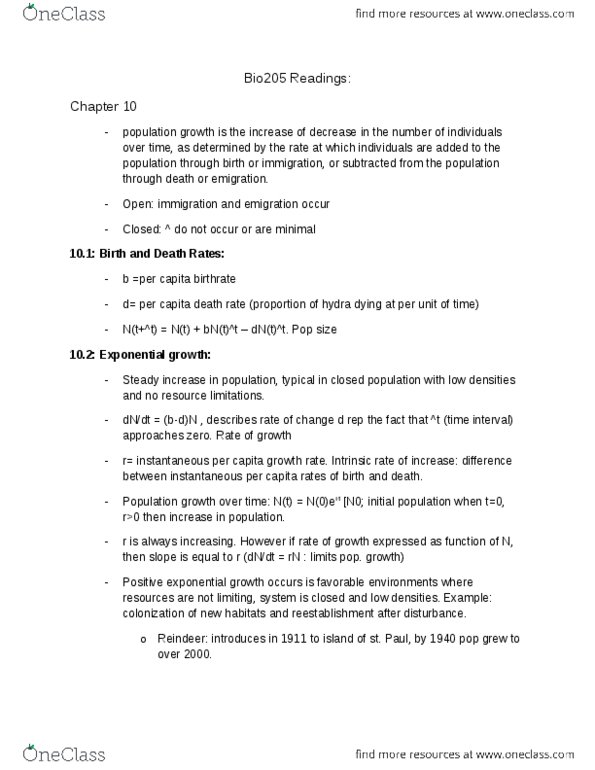
Finishing of demography then talk about populaion growth. Important biological reason for the log allows us to interpret the slope of that curve as meaning. If you had constant death rate of . 9 and then you make the table up. Nx can be used as a proxy of lx because it is directly proporional to lx due to its equaion. But then the values get very quickly squished up against the x axis. But when you do log of nx, then you can see the patern of survivorship. Allows you to see even though the vast majority have vanished. Nx+1 = nx + b d + i - e. Let"s assume the populaion is closed which means no dispersal which also means no immigraion or emigraion. Change in n/change in t = b d. Now let b and d be expressed per capita dn/dt = (b-d)n. We muliplied by n to maintain the equality.