CS 24000 Lecture Notes - Lecture 2: Gnu Debugger, Gnu Compiler Collection, Memory Leak

24 Jan 2017
School
Department
Course
Professor
Document Summary
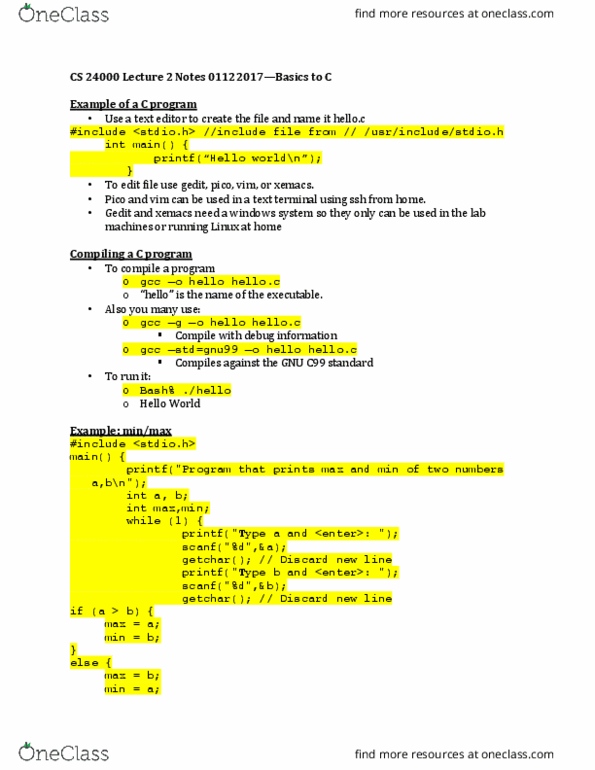
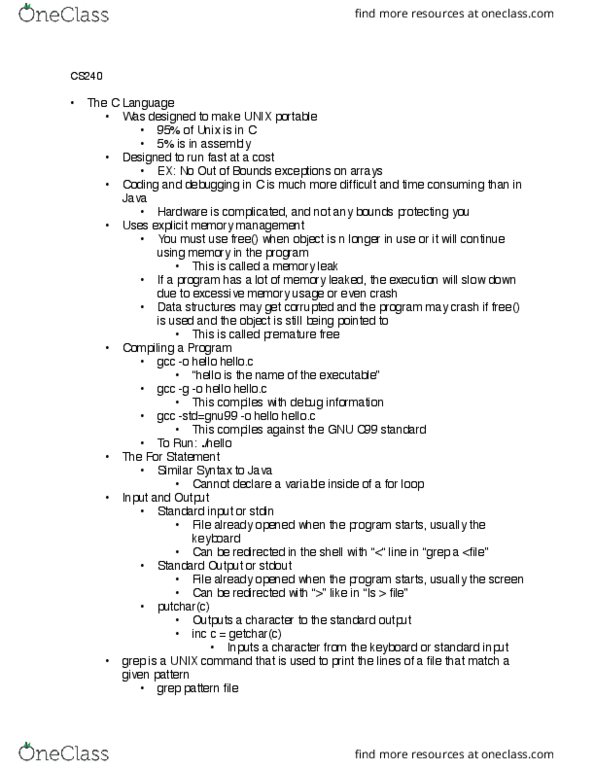
Next (will not enter into a function: setting breakpoints, you can set breakpoints in a program in multiple ways: break function, break line, break le:line, regaining the control. Run will start running the program and will stop at a break point. If the program is running without stopping, you can regain control again by typing ctrl+c: where is the program. Where will print the current function being executed and the chain of functions that are calling that function: this is also called backtrace, printing the value of a variable. Print var prints the value of a variable: exiting. May ask for reassurance: debugging a crashed program, this is called postmortem debugging , when a program crashes, it writes a core le, this le contains a snapshot of the program at the time of the crash. That includes what function the program was running: sometimes the system admins disable the generation of core.