FINC-220 Lecture Notes - Lecture 2: Cash Flow, Financial Statement, Income Statement

Document Summary
Get access


Related Documents
Related Questions
INSTRUCTION: Answer all questions in this section. Each question carries 2 marks. Answer True or False to the following questions.
1. The cash conversion cycle of a firm is the length of time between the actual cash outflow for materials and the actual cash inflow from sales. To calculate this cycle, we need all the information used to calculate the operating cycle plus Days Payables Outstanding (DPO).
2. Net working capital is defined as current liabilities minus current assets.
3. Sales volume and collection period will be affected by a firm's credit policy.
4. Accounts payable, or trade credit, increases net working capital.
5. Efficient cash management is often concerned with speeding up the collection of cheques received and slowing down the payment of cheques issued.
Choose the letter a, b, c, or d that carries the best response.
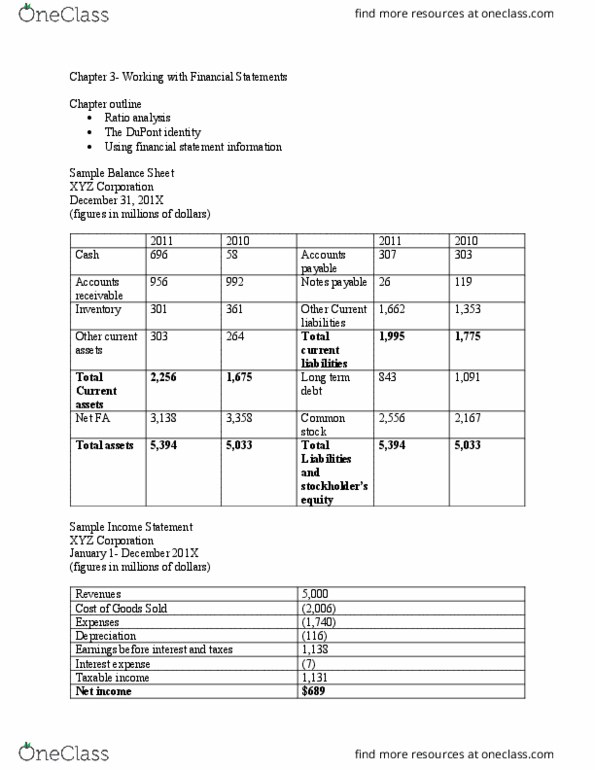
6. The income statement reports the results of operations during the past year, the most important item being:
Net Income
Interest Expense
Earnings Before Interest and Taxes
Earnings Per Share
7. Which would represent claims against assets in the balance sheet:
Liabilities
Liabilities and stockholders' equity
Common stockholders' equity
Both common and preferred stockholders' equity
8. The two accounts that normally make up the common equity section of the balance sheet are and
accounts payable; accruals
common stock; retained earnings
long-term bonds; common stock
equity; liabilities
9. Accounting profits is different from net cash flow because
Net cash flow includes profits from operations.
Non-cash items are not included in the accounting profits
Net-cash flows take account of all non-cash items
Accounting profits overlooks depreciation and taxes
| MGMT2023 | Page 3 |
10. Which of the following represents an investing cash outflow?
An increase in holdings of stocks of other companies
A decrease in accounts payable
A decrease in gross property, plant and equipment
A decrease in accumulated depreciation
11. Which group of ratios show the combined effect of liquidity, asset management and debt on operating results?
Liquidity ratios
Debt ratios
Coverage ratios
Profitability ratios
| 12. Cottler Ltd. has current. assets equal to $4.5 million. The company's current ratio is 1.25, and its quick ratio is 0.75. What is the firm's level of current liabilities in millions | |
| $3.6 | |
| $0.18 | |
| $2.4 | |
| $2.9 | |
13. You are given the following cash flows. What is the present value (t = 0) if the discount rate is 12 percent?
| Time | 0 | 1 | 2 | 3 | 4 | 5 | 6 |
| Cash flows | 0 | 1,000 | 2,000 | 2,000 | 2,000 | 0 | -2,000 |
| PV= ? | |
| $3,277 | |
| $4,169 | |
| $5,302 | |
| $4,289 |
14. You invest $5,000 today. You will earn 8% interest. How much will you have in 4 years? (Pick the closest answer.)
| $6,802 | |
| $6,843 | |
| $3,675 | |
| $3,475 |
15. You are buying your first house for $220,000 and are paying $30,000 as a down payment. You have arranged a 30-year mortgage loan With a 7% nominal interest rate and monthly payments. What are the equal monthly payments you must make?
| $1,513 | |
| $1,464 | |
| $1,264 | |
| $6,922 |

Compare Companies --- Netflix (NFLX) vs. GEO Holdings (TOK) Compute financial ratios, time value, variables, and returns using industry standard tools for optimizing financial success. Analyze corporate financial data in evaluating past and future financial performances.
Use formulas to calculate the following financial indicators for each year of data: Three fiscal years for Netflix and GEO Holdings for:
o Price to earnings ratio
o Debt to equity ratio
o Free cash flow
o Earnings per share
o Return on equity
o Net profit margin
V. Performance Over Time
A. Analyze the performance of the Netflix over time. What financial strengths and weaknesses does this company have? Consider addressing the free cash flows and ratios you calculated earlier.
B. Analyze the performance of your GEO Holdings over time. What financial strengths and weaknesses does this company have? Consider addressing the free cash flows and ratios you calculated earlier.
C. Analyze how the data differ between these two companies. Why do you think this is? Consider addressing the free cash flows and ratios you calculated earlier.
VI. Investment
A. Are the companies considered growth or value companies? Why?
B. Which companyâs stock is the better investment?
| Netflix Inc. (NMS: NFLX) | |||||
| Exchange rate used is that of the Year End reported date | |||||
| As Reported Annual Balance Sheet | |||||
| Report Date | 12/31/2016 | 12/31/2015 | 12/31/2014 | ||
| Currency | USD | USD | USD | ||
| Audit Status | Not Qualified | Not Qualified | Not Qualified | ||
| Consolidated | Yes | Yes | Yes | ||
| Scale | Thousands | Thousands | Thousands | ||
| Cash & cash equivalents | 1467576 | 1809330 | 1113608 | ||
| Short-term investments | 266206 | 501385 | 494888 | ||
| Current content library, net | - | - | 2125702 | ||
| Current content assets, net | 3726307 | 2905998 | - | ||
| Other current assets | 260202 | 215127 | 206271 | ||
| Total current assets | 5720291 | 5431840 | 3940469 | ||
| Non-current content library, net | - | - | 2773326 | ||
| Non-current content assets, net | 7274501 | 4312817 | - | ||
| Information technology assets | 185345 | 194054 | 189274 | ||
| Furniture & fixtures | 32185 | 30914 | 25758 | ||
| Building | 40681 | 40681 | 40681 | ||
| Leasehold improvements | 107945 | 107793 | 57339 | ||
| DVD operations equipment | 70152 | 88471 | 89144 | ||
| Capital work-in-progress | 108296 | 8845 | 12495 | ||
| Property & equipment, gross | 544604 | 470758 | 414691 | ||
| Less: accumulated depreciation | 294209 | 297346 | 264816 | ||
| Property & equipment, net | 250395 | 173412 | 149875 | ||
| Other non-current assets | 341423 | 284802 | 192981 | ||
| Total assets | 13586610 | 10202871 | 7056651 | ||
| Current content liabilities | 3632711 | 2789023 | 2117241 | ||
| Accounts payable | 312842 | 253491 | 201581 | ||
| Accrued expenses | 197632 | 140389 | 69746 | ||
| Deferred revenue | 443472 | 346721 | 274586 | ||
| Total current liabilities | 4586657 | 3529624 | 2663154 | ||
| Non-current content liabilities | 2894654 | 2026360 | 1575832 | ||
| Long-term debt | 3364311 | 2371362 | 900000 | ||
| Other non-current liabilities | 61188 | 52099 | 59957 | ||
| Total liabilities | 10906810 | 7979445 | 5198943 | ||
| Common stock | 1599762 | 1324809 | 60 | ||
| Additional paid-in capital | - | - | 1042810 | ||
| Foreign currency | -47966 | -42502 | -4615 | ||
| Change in unrealized gains on available for sale securities | -599 | -806 | 169 | ||
| Accumulated other comprehensive income (loss) | -48565 | -43308 | -4446 | ||
| Retained earnings (accumulated deficit) | 1128603 | 941925 | 819284 | ||
| Total stockholders' equity (deficiency) | 2679800 | 2223426 | 1857708 |
| Geo Holdings Corp (TOK: 2681) | |||||
| Due to changes with International Financial Reporting Standards (IFRS), recent financials statement presentations have been adjusted to meet this standard. Please note the original historical presentations have remained in the original format | |||||
| Exchange rate used is that of the Year End reported date | |||||
| As Reported Annual Balance Sheet | |||||
| Report Date | 03/31/2016 | 03/31/2015 | 03/31/2014 | ||
| Currency | JPY | JPY | JPY | ||
| Audit Status | Not Qualified | Not Qualified | Not Qualified | ||
| Consolidated | Yes | Yes | Yes | ||
| Scale | Millions | Millions | Thousands | ||
| Cash & deposits | 37683 | 32052 | 19869000 | ||
| Trade notes & accounts receivables | 4100 | 4077 | 3992000 | ||
| Merchandise | 24894 | 23834 | 23495000 | ||
| Deferred tax assets | 2156 | 1806 | 1773000 | ||
| Other current assets | 5462 | 7181 | 5942000 | ||
| Allowance for doubtful accounts | -281 | -292 | 343000 | ||
| Total current assets | 74015 | 68659 | 54729000 | ||
| Asset for rent, gross | 100974 | 104514 | 104647000 | ||
| Accumulated depreciation - asset for rent | -95154 | -97475 | 96055000 | ||
| Asset for rent, net | 5820 | 7038 | 8591000 | ||
| Buildings & structures, gross | 40872 | 39984 | 39478000 | ||
| Accumulated depreciation - buildings & structures | -27470 | -26362 | 25976000 | ||
| Buildings & structures, net | 13402 | 13622 | 13501000 | ||
| Land, net | 5844 | 6356 | 6651000 | ||
| Leased assets, gross | 2176 | 3519 | 4576000 | ||
| Accumulated depreciation - leased assets | -681 | -1764 | 2588000 | ||
| Leased assets, net | 1495 | 1754 | 1988000 | ||
| Other property, plant & equipment, gross | 24838 | 20562 | 17708000 | ||
| Accumulated depreciation - other property, plant & equipment | -18391 | -15292 | 13236000 | ||
| Other property, plant & equipment, net | 6447 | 5270 | 4471000 | ||
| Total property, plant & equipment | 33010 | 34043 | 35205000 | ||
| Total intangible assets | 1865 | 1277 | 2028000 | ||
| Investment securities | 926 | 1002 | 1266000 | ||
| Long-term loans receivable | 2250 | 6682 | 6628000 | ||
| Lease & guarantee deposits | 14905 | 14735 | 15034000 | ||
| Deferred tax assets | 3342 | 3774 | 2845000 | ||
| Other investments & other assets | 1222 | 1188 | 1760000 | ||
| Allowance for doubtful accounts | -1332 | -3751 | 3917000 | ||
| Total investments & other assets | 21315 | 23632 | 23617000 | ||
| Total non-current assets | 56192 | 58952 | 60851000 | ||
| Total assets | 130207 | 127612 | 115581000 | ||
| Trade accounts payable | 12631 | 13540 | 13124000 | ||
| Current portion of long-term borrowings | 8333 | 7097 | 8754000 | ||
| Current portion of bonds | 149 | 149 | 249000 | ||
| Income taxes payable | 4815 | 265 | 1170000 | ||
| Reserve for bonuses | 1665 | 1420 | 1135000 | ||
| Other current liabilities | 10135 | 12595 | 10279000 | ||
| Total current liabilities | 37731 | 35068 | 34713000 | ||
| Bonds | 105 | 254 | 403000 | ||
| Long-term borrowings | 19509 | 21843 | 13910000 | ||
| Lease liabilities | 1612 | 1660 | 1590000 | ||
| Deferred tax liabilities | 23 | 22 | 26000 | ||
| Asset retirement obligations | 4406 | 3994 | 3898000 | ||
| Other non-current liabilities | 1857 | 1554 | 1839000 | ||
| Total non-current liabilities | 27514 | 29329 | 21668000 | ||
| Total liabilities | 65246 | 64398 | 56381000 | ||
| Capital stock | 8871 | 8615 | 8603000 | ||
| Capital surplus | 3283 | 6090 | 6078000 | ||
| Retained earnings | 52542 | 49998 | 44381000 | ||
| Treasury shares | - | -1979 | 334000 | ||
| Total shareholders' equity | 64697 | 62724 | 58729000 | ||
| Valuation difference on available-for-sale securities | 166 | 282 | 297000 | ||
| Loss (gain) on deferred hedge | -15 | - | 297000 | ||
| Total accumulated other comprehensive income | 150 | 282 | 172000 | ||
| Stock acquisition rights | 113 | 206 | 59199000 | ||
| Net assets | 64961 | 63214 | 115581000 | ||
| Total liabilities & net assets | 130207 | 127612 |
| Netflix Inc. (NMS: NFLX) | |||||
| Exchange rate used is that of the Year End reported date | |||||
| As Reported Annual Income Statement | |||||
| Report Date | 12/31/2016 | 12/31/2015 | 12/31/2014 | ||
| Currency | USD | USD | USD | ||
| Audit Status | Not Qualified | Not Qualified | Not Qualified | ||
| Consolidated | Yes | Yes | Yes | ||
| Scale | Thousands | Thousands | Thousands | ||
| Revenues | 8830669 | 6779511 | 5504656 | ||
| Cost of revenues | 6029901 | 4591476 | 3752760 | ||
| Marketing expenses | 991078 | 824092 | 607186 | ||
| Technology & development expenses | 852098 | 650788 | 472321 | ||
| General & administrative expenses | 577799 | 407329 | 269741 | ||
| Operating income (loss) | 379793 | 305826 | 402648 | ||
| Interest expense | 150114 | 132716 | 50219 | ||
| Interest & other income (expense) | 30828 | -31225 | -3060 | ||
| Income before income taxes - United States | 188078 | 95644 | 325081 | ||
| Income (loss) before income taxes - foreign | 72429 | 46241 | 24288 | ||
| Income (loss) before income taxes | 260507 | 141885 | 349369 | ||
| Current tax provision (benefit) - federal | 54315 | 52557 | 86623 | ||
| Current tax provision (benefit) - state | 5790 | -1576 | 9866 | ||
| Current tax provision (benefit) - foreign | 60571 | 26918 | 16144 | ||
| Total current tax provision (benefit) | 120676 | 77899 | 112633 | ||
| Deferred tax provision (benefit) - federal | -24383 | -37669 | -10994 | ||
| Deferred tax provision (benefit) - state | -14080 | -17635 | -17794 | ||
| Deferred tax provision (benefit) - foreign | -8384 | -3351 | -1275 | ||
| Total deferred tax provision (benefit) | -46847 | -58655 | -30063 | ||
| Provision for (benefit from) income taxes | 73829 | 19244 | 82570 | ||
| Net income (loss) | 186678 | 122641 | 266799 | ||
| Weighted average shares outstanding - basic | 428822 | 425889 | 420546 | ||
| Weighted average shares outstanding - diluted | 438652 | 436456 | 431893 | ||
| Year end shares outstanding | 430054.212 | 427940.44 | 422910.887 | ||
| Net income (loss) per share - basic | 0.44 | 0.29 | 0.634 | ||
| Net income (loss) per share - diluted | 0.43 | 0.28 | 0.617 | ||
| Number of full time employees | 4500 | 3500 | 2189 | ||
| Number of part time & temporary employees | 200 | 400 | 261 | ||
| Total number of employees | 4700 | 3700 | 2450 | ||
| Number of common stockholders | 290 | 237 | 203 | ||
| Foreign currency translation adjustments | -5464 | -37887 | - | ||
| Geo Holdings Corp (TOK: 2681) | |||||
| Exchange rate used is that of the Year End reported date | |||||
| As Reported Annual Income Statement | |||||
| Report Date | 03/31/2016 | 03/31/2015 | 03/31/2014 | ||
| Currency | JPY | JPY | JPY | ||
| Audit Status | Not Qualified | Not Qualified | Not Qualified | ||
| Consolidated | Yes | Yes | Yes | ||
| Scale | Millions | Millions | Thousands | ||
| Total revenue | 267910 | 270308 | 262324000 | ||
| Cost of sales | -151798 | -157825 | 152301000 | ||
| Gross profit | 116112 | 112483 | 110022000 | ||
| Selling, general & administrative expenses | -99559 | -102925 | 100823000 | ||
| Operating income | 16552 | 9558 | 9198000 | ||
| Interest & dividend income | 49 | 114 | 111000 | ||
| Rental income | 1268 | 1167 | 1193000 | ||
| Other non-operating income | 1043 | 1062 | 453000 | ||
| Total non-operating income | 2361 | 2343 | 1758000 | ||
| Interest expense | -230 | -231 | 332000 | ||
| Rental expenses | -759 | -609 | 595000 | ||
| Transfer to reserve for doubtful account | - | -227 | - | ||
| Other non-operating expenses | -100 | -803 | - | ||
| Total non-operating expenses | -1089 | -1871 | 684000 | ||
| Ordinary income | 17824 | 10030 | 1612000 | ||
| Imapirment loss | -1319 | -1543 | 9344000 | ||
| Other extraordinary losses | -13 | - | 203000 | ||
| Total extraordinary losses | -1333 | -1543 | 203000 | ||
| Income before income taxes | 16491 | 8486 | 1218000 | ||
| Income taxes - current | -5779 | -2074 | 514000 | ||
| Income taxes - deferred | -147 | 925 | 87000 | ||
| Total income taxes | -5927 | -1149 | 1821000 | ||
| Profit | 10563 | 7337 | 7726000 | ||
| Profit attributable to owners of parent | 10563 | 7337 | 4027000 | ||
| Average number of shares outstanding - basic | 51.331 | 53.169 | -39000 | ||
| Average number of shares outstanding - diluted | 51.623 | 53.29 | 3987000 | ||
| Year end shares outstanding | 48.244 | 52.295 | 3738000 | ||
| Earnings per share - basic | 205.78 | 137.99 | -70000 | ||
| Earnings per share - diluted | 204.62 | 137.68 | 3808000 | ||
| Number of full time employees | 3825 | 3579 | 53996.5 | ||
| Number of part time employees | 10421 | 10114 | 54066.499 | ||
| Number of common stockholders | 57105 | 65030 | 53996.5 | ||

Just need the last two questions answered A and B at the bottom of the document
Youâre the chief financial officer (CFO) of Worldwide
Widget Manufacturing, Inc. The company manufactures and
sells widgets at factories in the United States and internationally.
Listed below are partial financial statements for Worldwide
Widget Manufacturing, Inc. Fill in the missing information in
each of the following financial statements. Answer spaces are
given below.
Worldwide Widget Manufacturing, Inc.
Balance Sheet as of December 31, 2015 and 2014
(in millions of dollars)
| 2015 | 2016 | 2015 | 2016 | ||
| Assets Current Assets: | Liabilities and Equity Current Liabilities: | ||||
| Cash and markatable securities | $427 | $322 | Accured wages and taxes | $309 | $257 |
| Accounts Receivable | a.? | 259 | Accounts payable | 381 | b.? |
| Inventory | 815 | 797 | Notes Payable | $492 | $421 |
| Total | $1,542 | $1,378 | Total | $1,182 | $997 |
| Fixed Assets: | Long-term debt: | $1,934 | c.? | ||
| Gross plant and equipment | d.? | $2,817 | Total | 3,116 | 2,956 |
| Less:depreciation | 368 | 254 | Stockholder's equity: | ||
| Net plant and equipment | $2,872 | $2,563 | Preferred stock ( 30 million shares) | $30 | $30 |
| Other long term assets | 521 | 487 | Common stock and paid in surplus (250 million shares) | 300 | e.? |
| Retained earnings | 1,489 | 1,142 | |||
| Total FA | f.? | $3,050 | Total Equity | $1,819 | $1,472 |
| Total Assets | $4,935 | $4,428 | Total liabilities and equity | $4,935 | $4,428 |
A. Accounts receivable for 2015_______300
B. Accounts payable for 2014_______319
C. Gross plant and equipment for 2015_______1959
D. Long-term debt for 2014_______3240
E. Common stock and paid-in surplus (250 million shares) for 2014_______300
F. Total FA for 2015_______3393
Worldwide Widget Manufacturing, Inc. Income Statement for Years Ending December 31, 2015 and 2014(in millions of dollars)
| 2015 | 2014 | |
| Net Sales | g. | $2018 |
| Less: Cost of Goods Sold | 753 | h.? |
| Gross Profits | $1,623 | $1,189 |
| Less: Other Operating Expense | 423 | 167 |
| Earnings before interest, taxes, depreciation, and amortization (EBITDA) | $1,200 | $1,022 |
| Less: Depreciation | 114 | 114 |
| Earning before interest and taxes (EBIT) | $1,086 | $908 |
| Less: Interest | i.? | 128 |
| Earnings:before Taxes (EBT) | $949 | $780 |
| Less:Taxes | j.? | 23 |
| Net Income | $664 | $546 |
| Less:Preferred stock dividends | 98 | 98 |
| Net income available to common stock holders | $566 | $448 |
| Less:Common stock dividends | 219 | 199 |
| Addition to retained earnings Per common share data: | $347 | $249 |
| Earnings per share (EPS) | k.? | $1.79 |
| Dividends per share (DPS) | $0.88 | l. ? |
| Book Value per share (BVPS) | m.? | $5.77 |
| Market Value per share (MVPS) | $23.97 | $22.47 |
g. Net sales for 2015_______2376
h. Less: Cost of goods sold for 2014_______829
i. Less: Interest for 2015_______137
j. Less: Taxes for 2015_______285
k. Earnings per share (EPS) for 2015_______1.88
l. Dividends per share (DPS) for 2014_______.73
m. Book value per share (BVPS) for 2015_______7.16
Worldwide Widget Manufacturing, Inc.
Statement of Cash Flows for Year Ending December 31, 2015
(in millions of dollars)â
| Section A: Cash Flows from operating activities | |
| Net Income | n.? |
| Additions (source of cash): Depreciation | 114 |
| Increase in accrued wages and taxes | o.? |
| Increase in accounts payable | 62 |
| Subtractions (use of cash): Increase in accounts receivable | -41 |
| Increase in inventory | p.? |
| Net Cash flow from operating activities | q.? |
| Section B: Cash Flows from investing activities subtractions: Increase in fixed assets | -$343 |
| Increase in other long-term assests | r.? |
| Net Cash flow from investing activities | s.? |
| Section C. Cash flows from financing activities Additions: Increase in notes payable | t.? |
| Increase in common and preferred stock | 0 |
| Subtractions: Decrease in long-term debt | -25 |
| Pay dividends | u.? |
| Net Cash flow from financing activities Section D. Net Change in cash and marketable securities | v.? $105 |
n. Net income_______664
o. Increase in accrued wages and taxes_______52
p. Increase in inventory_______18
q. Net cash flow from operating activities_______833
r. Increase in other long-term assets_______34
s. Net cash flow from investing activities_______-377
t. Increase in notes payable_______71
u. Pay dividends_______317
v. Net cash flow from financing activities_______-271
Worldwide Widget Manufacturing, Inc.
Statement of Retained Earnings as of December 31, 2015
(in millions of dollars)
| Balance of retained earnings, December 31,2014 | $1,142 | |
| Plus: Net income for 2015 | w.? | |
| Less: Cash dividends paid | 0 | 0 |
| Preferred stock | x.? | |
| Common Stock | 219 | |
| Total cash dividends paid | 317 | |
| Balance of retained earnings, December 31,2015 | $1,489 |
w. Plus: Net income for 2015 _______664
x. Preferred stock _______98
2. Youâll need to compare your companyâs ratios with the industryâs standards.
Worldwide Widget Manufacturing, Inc.
| Company | Industy | Comparison | |
| Current Ratio | 2.2 times | ||
| Quick Ratio | 1.1 times | ||
| Cash Ratio | 0.35 times | ||
| Inventory turnover | 2 times or 1 time | ||
| Days' sales in inventory | 135 days or 335 days | ||
| Average payment period | 110 days | ||
| Sales to working capital | 3 times | ||
| Total asset turnover | 0.6 times | ||
| Debt-to equity | 1.1 times | ||
| Profit margin | 16.5% | ||
| Gross profit margin | 48.13% | ||
| ROA | 8.78% | ||
| ROE | 19.45% | ||
| Divident payout | 32% |
A. Use the information found in Worldwide Widget Manufacturingâs financial statements
to calculate all of the listed financial ratios in the above table for your
company. Then, for each ratio, provide a comparison of the companyâs result
with the industry standards, indicating if your companyâs results are lower than,
higher than, slower than, or faster than the industry standards.
B. Calculate your companyâs internal and sustainable growth rates.
