ECON 174 Lecture Notes - Lecture 2: Efficient-Market Hypothesis, Time Series, Vise

13 Jan 2020
School
Department
Course
Professor
Document Summary
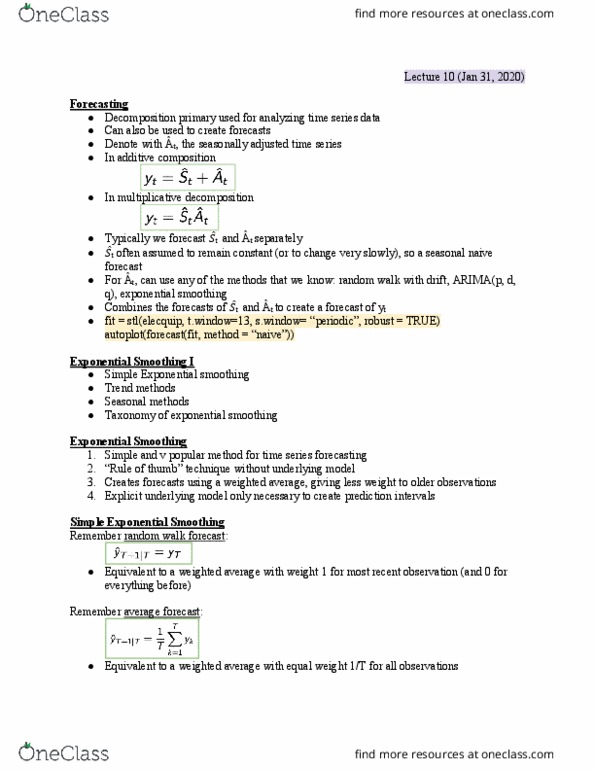
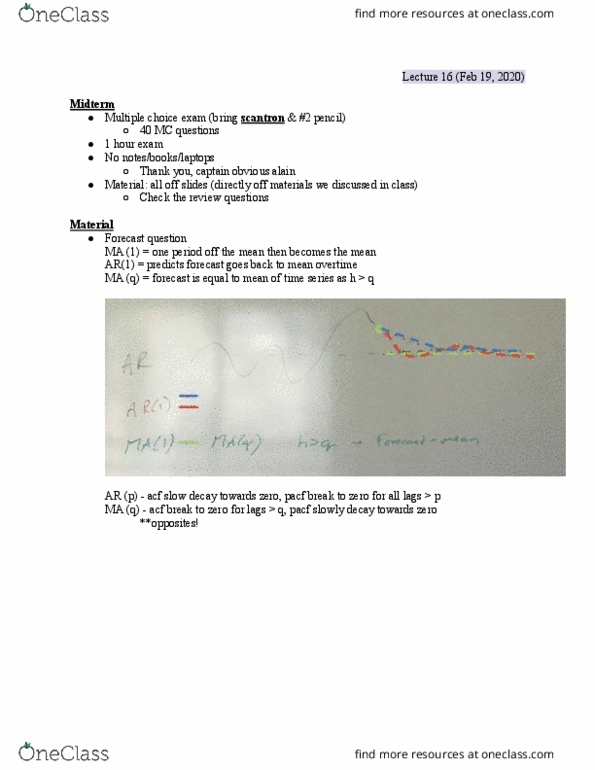
A time series is a collection of random variables yt. We refer to the time series process with {y1, y2, , yt-1, yt }, or simply {yt ,t t}, or even more simply {yt} . We refer to the forecast of the outcome of yt with y t . To refer to the forecast made at time t for the outcome h periods ahead, we write y t+h|t . Similarly, y t|t h refers to the forecast of yt that was made h periods ago. Y = not data but something we forcasted (our prediction) Ex: y 2021|2020 = prediction of 2021 (forecast) based on 2020 data. Forecast example #1 - us real gdp growth rate. Overtime, the average growth rate is relatively stable (line across that shows average growth rates for each year) = mean reverting. Forecast is equal to the average of all historical data: Good for long run forecast of processes that exhibit mean reversion.