AMS 315 Lecture Notes - Lecture 7: System Of Linear Equations, Local Regression, Simvastatin
49 views25 pages

10 Sep 2018
School
Department
Course
Professor
Document Summary
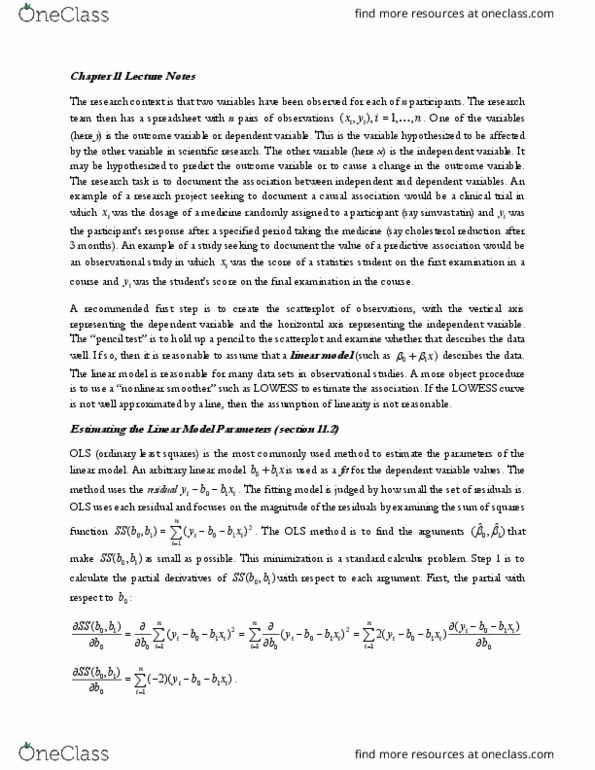
The research context is that two variables have been observed for each of n participants. The research team then has a spreadsheet with n pairs of observations. One of the variables (here y) is the outcome variable or dependent. This is the variable hypothesized to be affected by the other variable in scientific research. The other variable (here x) is the independent variable. It may be hypothesized to predict the outcome variable or to cause a change in the outcome variable. A recommended first step is to create the scatterplot of observations, with the vertical axis representing the dependent variable and the horizontal axis representing the independent variable. The pencil test is to hold up a pencil to the scatterplot and examine whether that describes the data well. If so, then it is reasonable to assume that a linear model (such as. 1 linear model is reasonable for many data sets in observational studies.
Get access
Grade+20% off
$8 USD/m$10 USD/m
Billed $96 USD annually

Homework Help
Study Guides
Textbook Solutions
Class Notes
Textbook Notes
Booster Class
40 Verified Answers
Class+
$8 USD/m
Billed $96 USD annually

Homework Help
Study Guides
Textbook Solutions
Class Notes
Textbook Notes
Booster Class
30 Verified Answers