BIO 202 Lecture Notes - Lecture 1: Quadratic Equation

14 Nov 2018
School
Department
Course
Professor
Document Summary
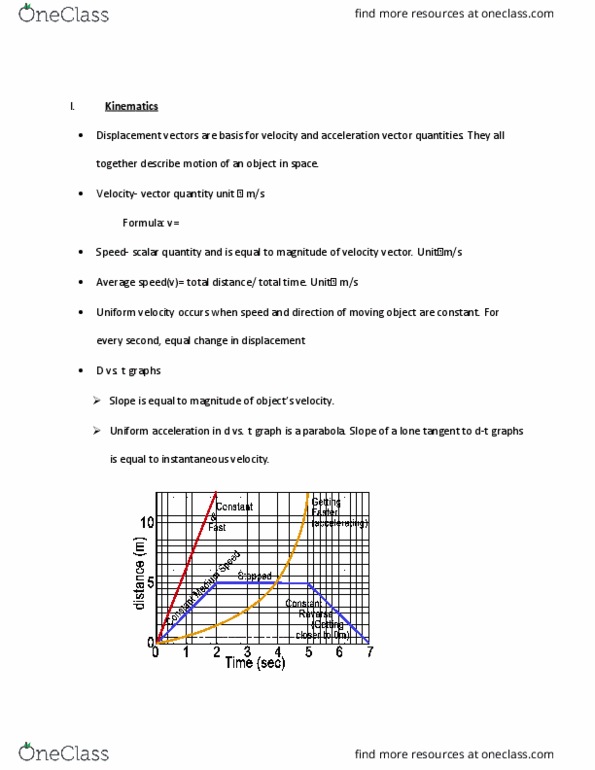
In order to begin an investigation of graphical analysis, a few terms need to be defined. First off is velocity and velocity measures the magnitude of speed of an object in a given direction. Instantaneous velocity is specifically defined as the velocity of an object at a particular moment. Scientists are able to portray such measurements of velocity through graphical analysis. For the particular graphs to portray the data in this experiment, the graphs represented measurements of displacement vs. time, along with velocity vs. time. The aim of the experiment was to determine how the displacement and acceleration of a moving object could have been determined through velocity vs. time, and displacement vs. time graphs. The hypothesis for this particular experiment was that the slope of a displacement vs. time graph would determine instantaneous velocity, whereas displacement would be easily determined by simply calculating the area beneath a velocity vs. time graph.