BUS 215 Lecture Notes - Lecture 3: Public Interest Research Group, Exploratory Data Analysis, Atorvastatin

4 Apr 2016
School
Department
Course
Professor
Document Summary
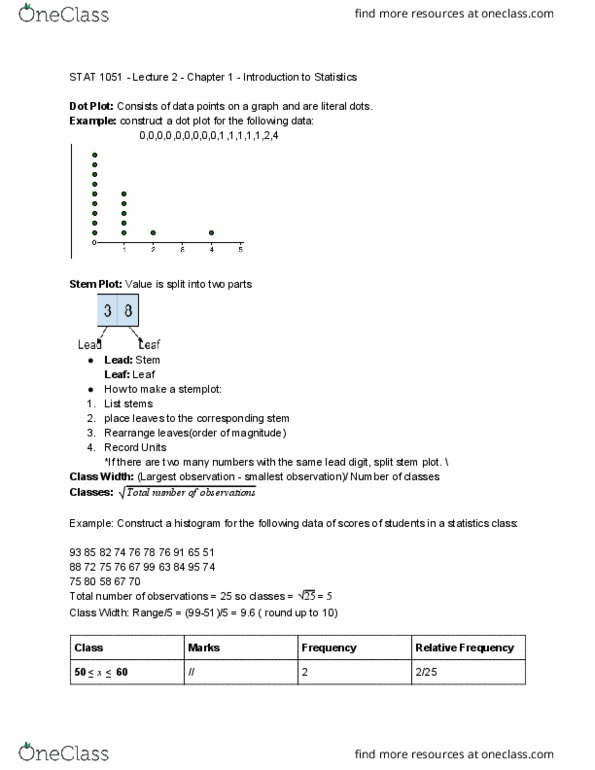
The stem-and-leaf plot is a tool of exploratory data analysis (eda) that seeks to reveal essential data features in a simple way. A stem-and-leaf plot is basically a frequency tally, except that we use digits instead of tally marks. For two-digit or three- digit integer data, the stem is the tens digit of the data, and the leaf is the ones digit. For example, suppose we have exam scores for 22 students, arranged from lowest to highest: Contains data items 60, 64, 66, 69. Contains data items 71, 73, 73, 76, 77, 79. Contains data items 80, 80, 81, 82, 82, 85, 85, 87. The stem-and-leaf is like a histogram, in that it uses equally-spaced classes and can reveal modality as well as the range. For example, this stem-and-leaf plot shows that most exam scores were in the 80s. The leaf digits have been sorted, although this is not necessary.