MAT 121 Lecture Notes - Lecture 3: On2 Technologies, Frequency Distribution, 32X

9 Oct 2014
School
Department
Course
Professor
Document Summary
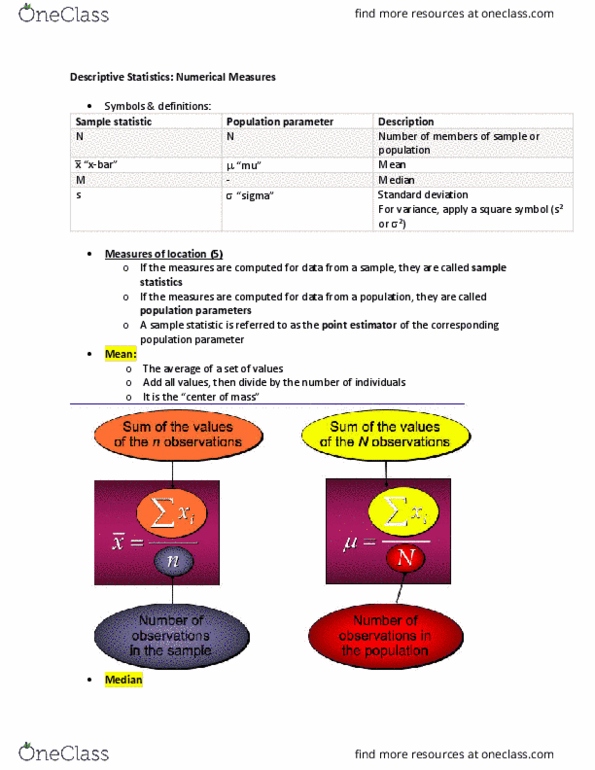
= middle value when the original data values are arranged in increasing ! order. Mat 121: elementary statistics and probability- lecture 3: mean, median, Range, and mode: median= denoted by x- tilde (no symbol available), mode= value that occurs most often within a set of numbers, midrange= ! = can have none! max value - min value. 2: population mean= = parameter, = sum of all data, n= all population! Multiply each frequency by its corresponding class midpoint, then add them up! = x = sum of all data. N = population: sample mean= the mean of a sample ! = used to estimate the population mean: frequency distribution=! x-bar= (f*x) Divide that by the sum of all frequencies within the sample! = used for when you no longer have the original values, or you cannot get the exact values. You assume all values in each class are equal to the class midpoint: weighted mean= ! x-bar= (w*x)