MAT 121 Lecture Notes - Lecture 2: Ogive, Scatter Plot, Acura

9 Oct 2014
School
Department
Course
Professor
Document Summary
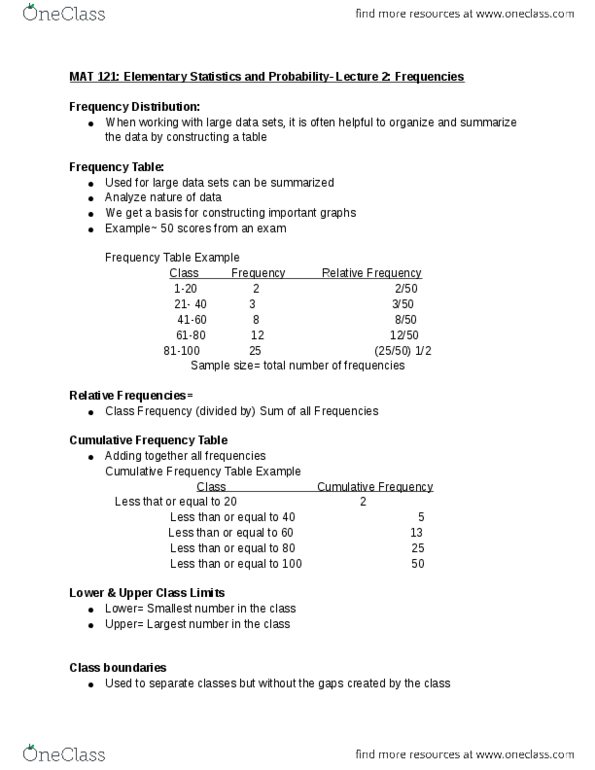
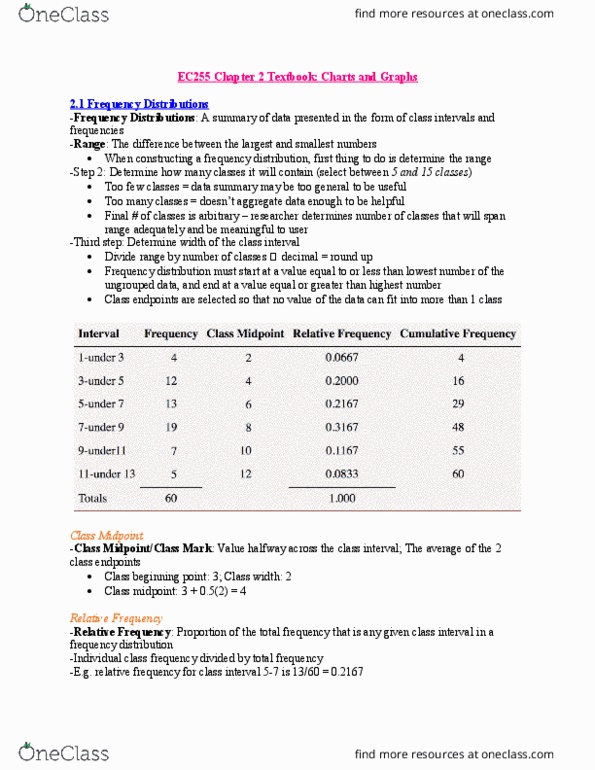
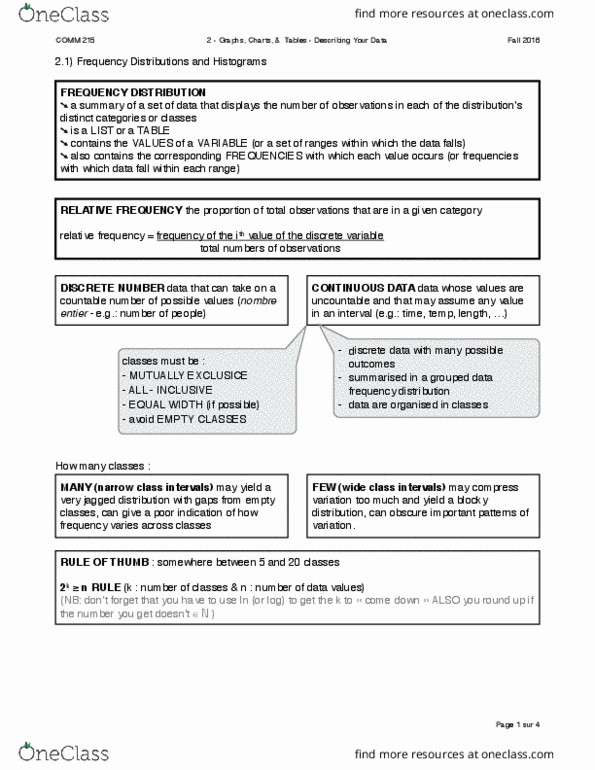
Mat 121: elementary statistics and probability- lecture 2: frequencies. When working with large data sets, it is often helpful to organize and summarize the data by constructing a table. Used for large data sets can be summarized. We get a basis for constructing important graphs. Class frequency (divided by) sum of all frequencies. Used to separate classes but without the gaps created by the class. Values in the middle of the class. Difference between two consecutive lower or upper class limits or 2 consecutive class boundaries. How to build a table from different values: Determine number of classes (no less than 5, no more than 20) Calculate the class width using the following formula (always rounding up even if it is a whole number) Width= (max values- min values)/ # of classes. Choose the minimum data value or a convenient value below it as the first lower class limit.