MAT 121 Lecture Notes - Lecture 10: Random Variable, Normal Distribution, Standard Deviation

27 Oct 2014
School
Department
Course
Professor
Document Summary
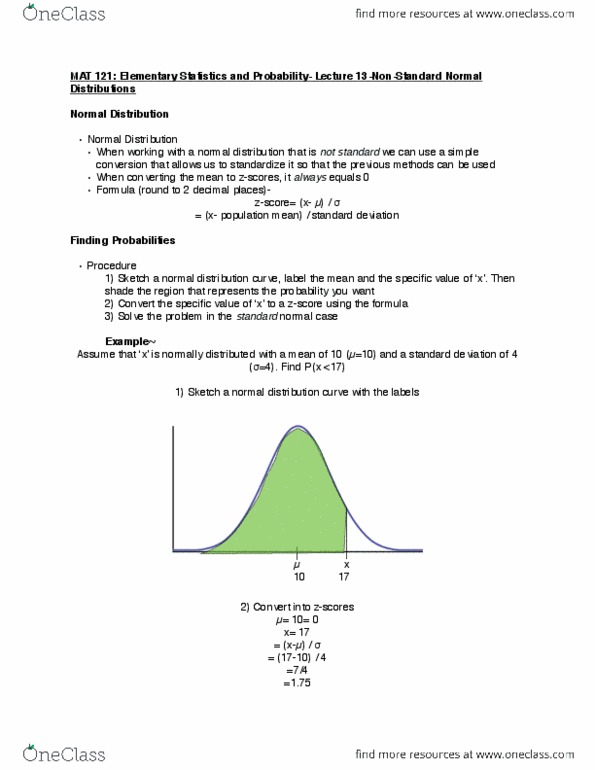
Mat 121: elementary statistics and probability- lecture 10: density curves. Review from last lecture: p(at least 1) = 1- p(0) Suppose a treatment is successful 90% of the time. This treatment is used on 14 randomly selected patients. Find the probability of seeing 11 successes in those 14 patients. Mean, variance, and standard deviation for binomial distribution: mean= = n*p, variance= ^2= n*p*q, standard deviation= = n*p*q. Find the corresponding mean and standard deviation ( & ) n=14 p= . 9 q= . 1. Density curve: probability defined by a curve if, area under the curve is equal to 1, curve is above horizontal scale. Find the shaded area, if the left equals . 73. Area and probability: if x" has a probability distribution defined by a curve, p(a x b) a b. Uniform distribution: random variable x has a uniform distribution on an interval from a to b if all values from a to if all values are equally likely (spread evenly).