MAT 221 Lecture Notes - Lecture 1: Pie Chart, Interquartile Range, Histogram


57
MAT 221 Full Course Notes
Verified Note
57 documents
Document Summary
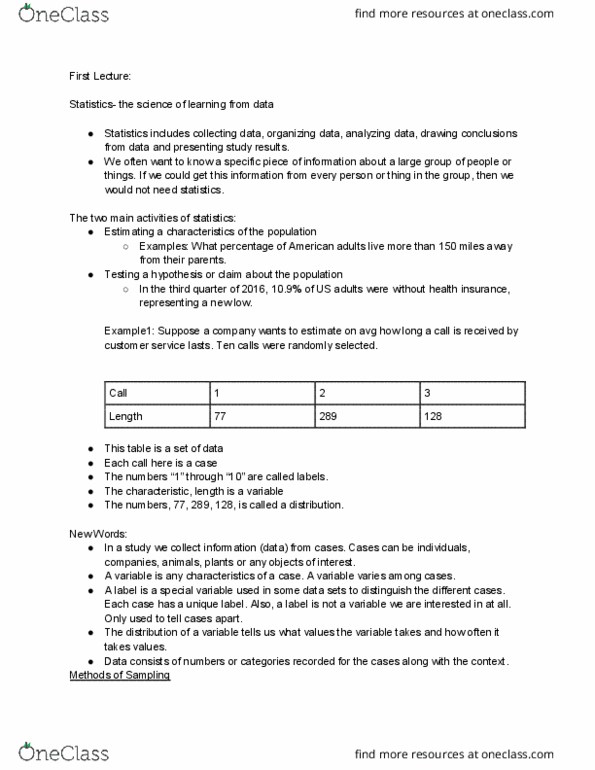
Statistics is the science of learning from data. Statistics includes collecting data, organizing data, analyzing data, drawing conclusions from data and presenting study results. We often want to know a specific piece of information about a large group of people or things. If we could get this information from every person or thing in the group, then we would not need statistics. Testing a hypothesis or claim about the population. In a study, we collect information(data) from cases. Cases can be individuals, companies animals, plants, or any objects of interest. A variable is any characteristic of a case. A label is a special variable used in some data sets to distinguish the different cases. Also, a label is not a variable that we are interested in studying. It is only used to tell the cases apart. The distribution of a variable tells us what values the variable takes and how often it takes these values.