PSY 101 Lecture 3: Lecture 3 Continued

12 Feb 2017
School
Department
Course
Professor
Document Summary
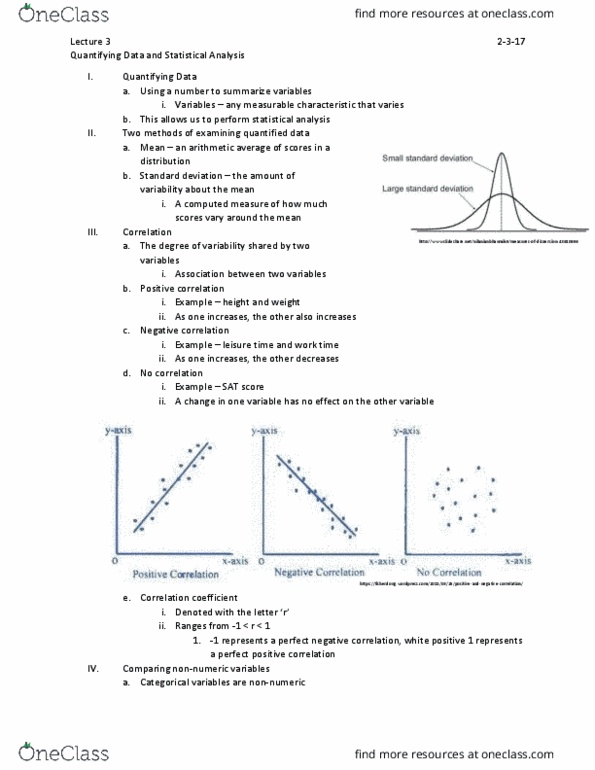
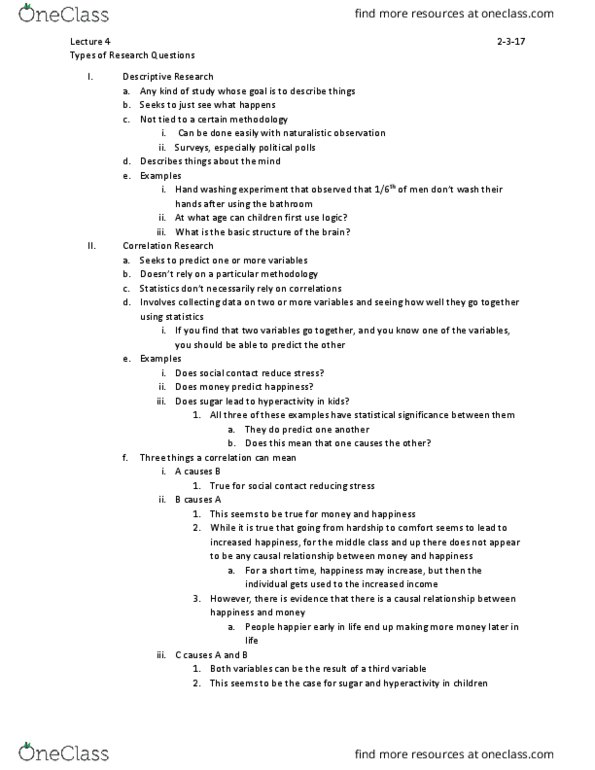
Quantifying data: using numbers to summarize variables, variables. Example: happiness and reaction time: mean. Arithmetic average of scores in a distribution: standard deviation. Computed measure of how many scores vary around the mean. Find how two variables go together: example: sat scores and college performance. Correlation: degree of variability shared by two variables. Correlational coefficient: r, example: r = . 50, ranges from -1 to +1. +1 = perfect positive: r for height and weight is . 70. Categorical variables: not numeric, mean differences between groups, example: how sat scores differ based on what school. Sample: subgroup of population examined in a particular study. Representative sample: sample that contains all of the variation present in a broader population. Statistical significance: likelihood that a correlation or group difference in a sample is not due to random chance, two factors, size of the effect, size of the sample, example, big sample- more likely to be statistically significant.