STAT 400 Lecture Notes - Lecture 2: Random Variable, Statistical Population, Quartile
76 views3 pages

27 Jun 2017
School
Department
Course
Professor
Document Summary
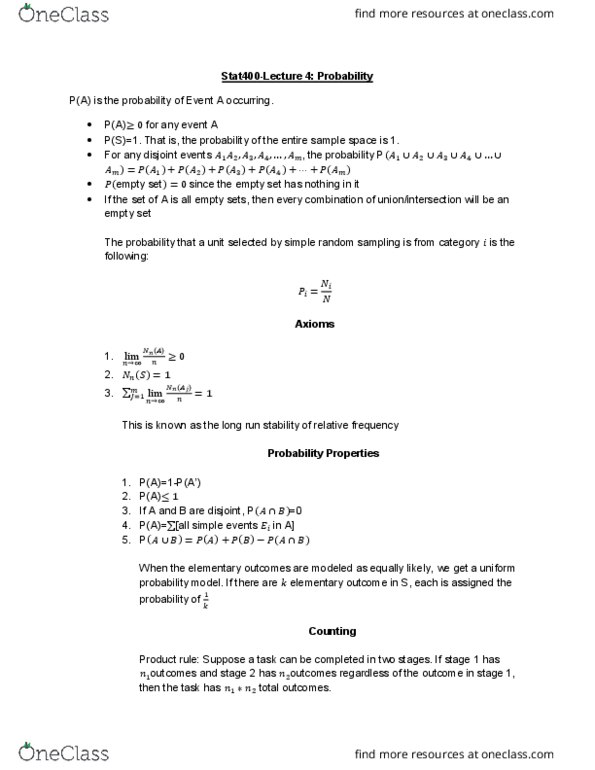
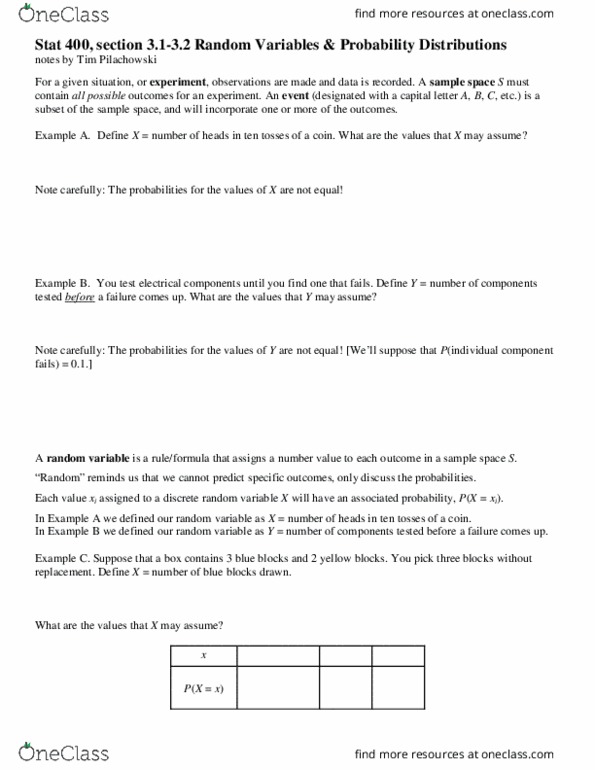
Relative frequency of pizza" is 5/16 or 0. 3125. How to space the bars for continuous variables. Find the min and max of the data. Choose intervals that cover the range between the min and max boundaries without overlap. This is also called a class interval. The count of occurrences in each interval is cell frequency. Consider a population of n units, and let (cid:2869), (cid:2870), (cid:2871),denote the statistical population. If the random variable x denotes the value of a randomly selected population unit, then the expected value or x or the mean value is denoted by e(x) The sample mean approximates the population mean. Median: the middle value when measurements are arranged from smallest to largest. It is denoted by x with a tilda on top. The median is not affected by a few very small or large values. For extremely asymmetrical distributions, the median is likely to be a more sensible measure of center than the mean.
Get access
Grade+20% off
$8 USD/m$10 USD/m
Billed $96 USD annually

Homework Help
Study Guides
Textbook Solutions
Class Notes
Textbook Notes
Booster Class
40 Verified Answers
Class+
$8 USD/m
Billed $96 USD annually

Homework Help
Study Guides
Textbook Solutions
Class Notes
Textbook Notes
Booster Class
30 Verified Answers