BNAD 276 Lecture Notes - Lecture 1: Confidence Interval, Statistical Theory, Test Statistic

20 Jan 2017
School
Department
Course
Professor
Document Summary
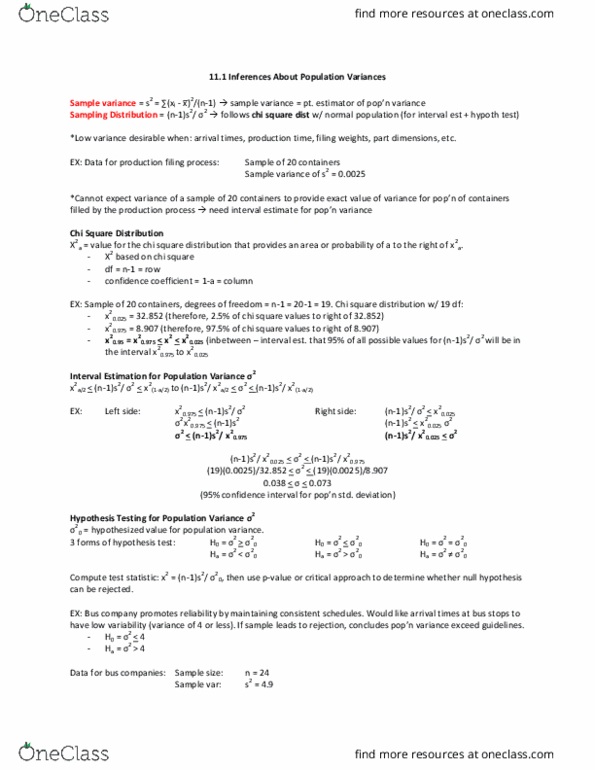
Inferences about 2 are based on the sample variance s2. These inferences are based on a new distribution = the chi-square or x2 distribution. Statistical theory shows how the sample variance s2 is related to its population counterpart 2. Under certain assumptions, the test statistic x2 df distribution with df= n-1. X2 ,df represents a value such that the area in the right tail of the distribution is . If we want to find the value such that the area to the left of the x2. A 100(1- )% confidence interval of the population variance 2 is computed as. 1- , df represents a value such that the area in the left tail of the distribution is df distribution depends on the degrees of freedom, df= n-1 df= (n-1)s2/ 2, follows the x2. 95% confidence interval (cid:3118)(cid:3118), (cid:3118)(cid:3117) (cid:3118) , ] where df = n-1. 2 (cid:4666)(cid:2869)(cid:2868) (cid:2869)(cid:4667)(cid:2871)7. (cid:2869)(cid:2871)(cid:3118) (cid:2869)9. (cid:2868)(cid:2870)(cid:2871) (cid:2870). 7.