ECON 1001 Lecture Notes - Lecture 13: Hyperbola, Inverse Relation, Demand Curve

Document Summary
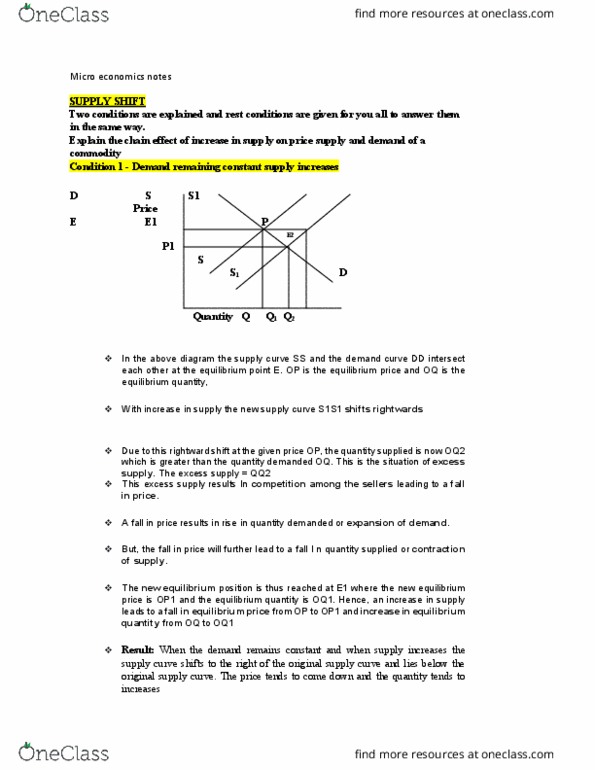
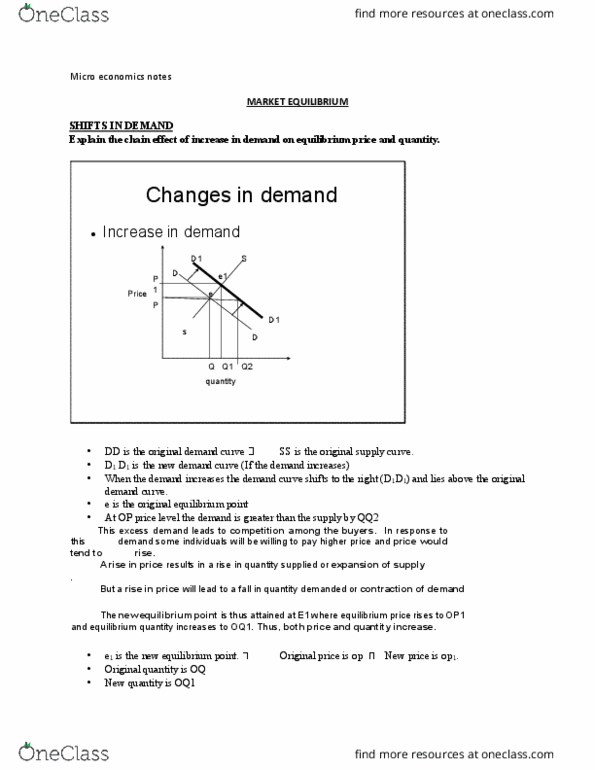
Demand curve: it is graphic representation of demand schedule showing how quantity demanded of a commodity is related to its own price. The demand curve is downward sloping because of the inverse relation between price and demand. It can also be a rectangular hyperbola for a normal good it is generally downward sloping. Point e on demand curve shows that at price op the consumer is willing to buy oq quantity of good. Market demand curve is the horizontal summation of the individual demand curves. It shows various quantities of a commodity that all the buyers in the market are ready to buy at different possible prices of the commodity at a point of time. Note: both the graphs are based on the previous schedule given. Movement along the demand curve and shift of demand curve. When price increases from op to op1 the quantity demanded contracts to oq1. When price falls to op2 the quantity demanded expands to op2.