CHEM 1A Lecture Notes - Lecture 13: Boiling Point, Soot, Radiant Energy

2 Dec 2015
School
Department
Course
Professor


44
CHEM 1A Full Course Notes
Verified Note
44 documents
Document Summary
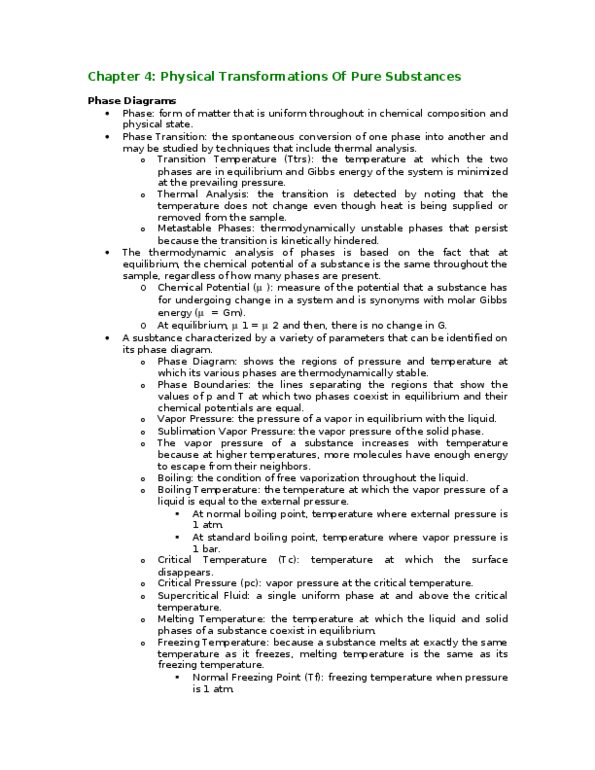
Representing changes in states using graphs: heating curve: plot of temperature (y-axis) heat absorbed (or supplied) (x-axis) topic is graphs. Understand what the graph is conveying draw it here: phase diagram: plot of pressure (y-axis vs temperature) (x-axis/in a closed system -not open to the external atmosphere. if they all coexist=triple point. Each of the lines separate the physical state. The center line represents where water and ice coexist. when water vapor=external temp --->boiling point critical point=cant distinguish if it is a liquid or gas because merged together. In between boiling point is based of external pressure. Only liquid water has a critical point the curvy line represents the melting point of any. *** water is the only one that forms a negative slope. ******for every other substance, water is unique. solid less dense than liquid. take the melting point and look at pressure dependence. increase pressure, melting point decreases--->water only. water w pressure melting point decreases.