STA 1063C Lecture Notes - Lecture 3: Tally Marks, Frequency Distribution, Minimax

Document Summary
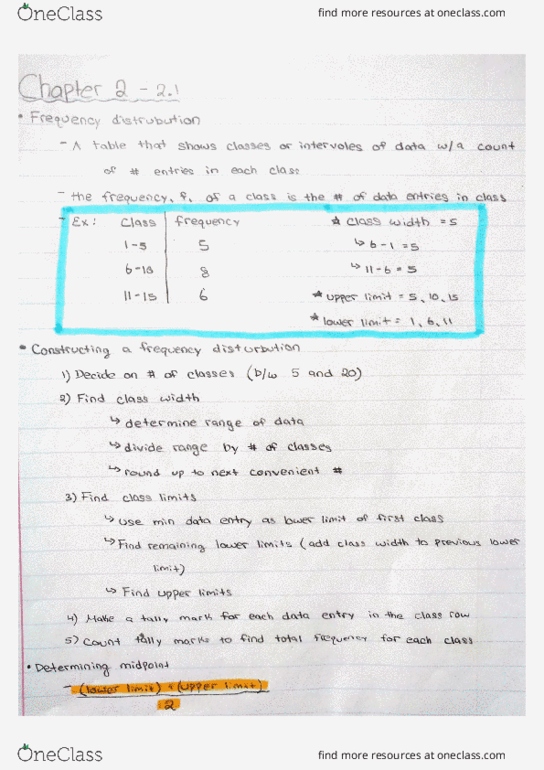
Class width: the difference between two consecutive lower class limits. Between 5 and 20, depending on data set size: find class width- divide the range (max-min) by the number of classes and round up to the convenient number, find class limits. Start with the min as your first lower class limit. Add the class width to find next lower class limit, find upper class limits: tally your data, count tally marks to find total frequency. Width= range/number of classes, round (125-67)/5= 11. 6= 12. Class limits frequencies midpoint relative frequency cumulative frequency. After first midpoint, add class width for other classes. Relative frequency: percentage of data in that class (class frequency/ total frequency) Cumulative frequency: sum of f for that class and all previous class. Frequency histogram- bar graph of a frequency distribution: horizontal scale is quantitative, vertical scale measures frequencies, consecutive bars must touch. **to determine class boundaries, subtract 0. 5 from lower limits and add 0. 5 to upper limits**