PSYCH 100A Lecture 19: Psych 100A W9L2 3/9/17

Document Summary
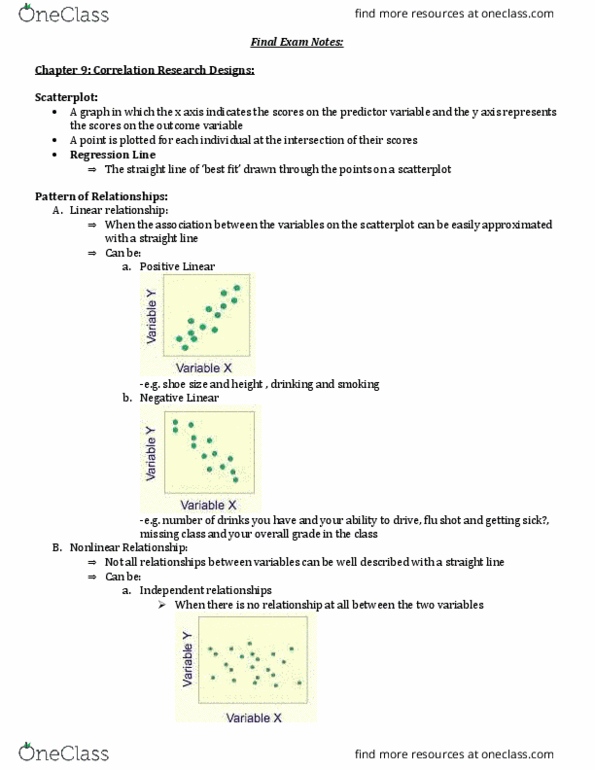
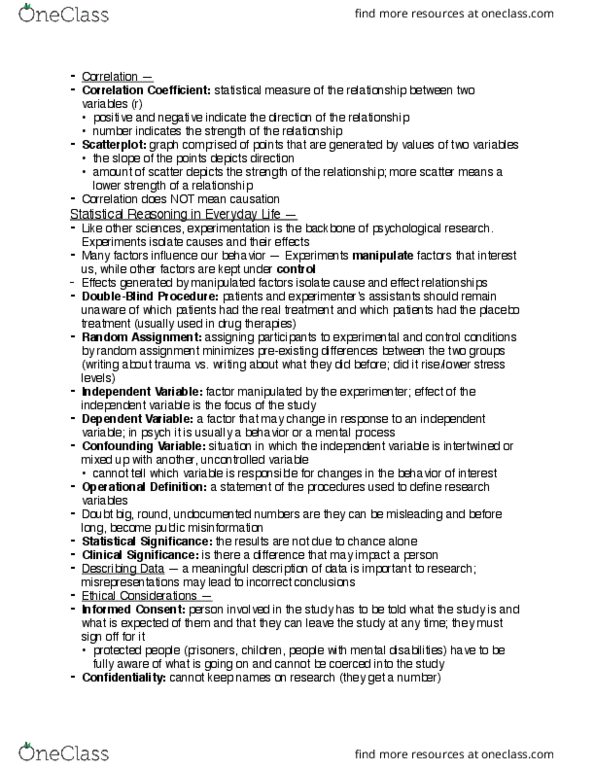
When variables are continuous, we have to use each value as its own category or create cut-off values for categories. E. g. drinking, we can have anywhere between 0 - 10 or more drinks. Categorize as low and high drinking (cut off values) If our cut off is 3 drinks for high drinking, the problem rises when someone has. 2. 9 drinks and another person has 3. 1 drinks. The two aren"t that different but they would be in different categories. We have to do controlled experiments to determine causation. E. g. double-blind, randomized experiments eliminates variability in. Correlation does not have independent and dependent variables treatment due to pygmalion effect and placebo effect. Pearson"s r: quantifies a relation between two variables. Value of the number indicates the strength of the relationship. Negative correlation means the variables are inversely related. When one variable increases the other decreases. Scatter plot: each point represents two variable values belonging to one person.