STATS 10 Lecture Notes - Lecture 1: Pie Chart, Pareto Chart, Histogram

Document Summary
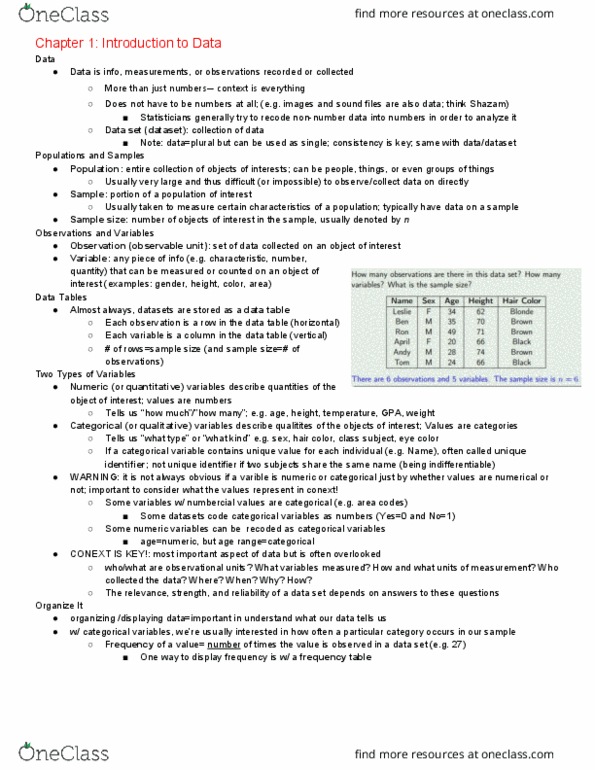
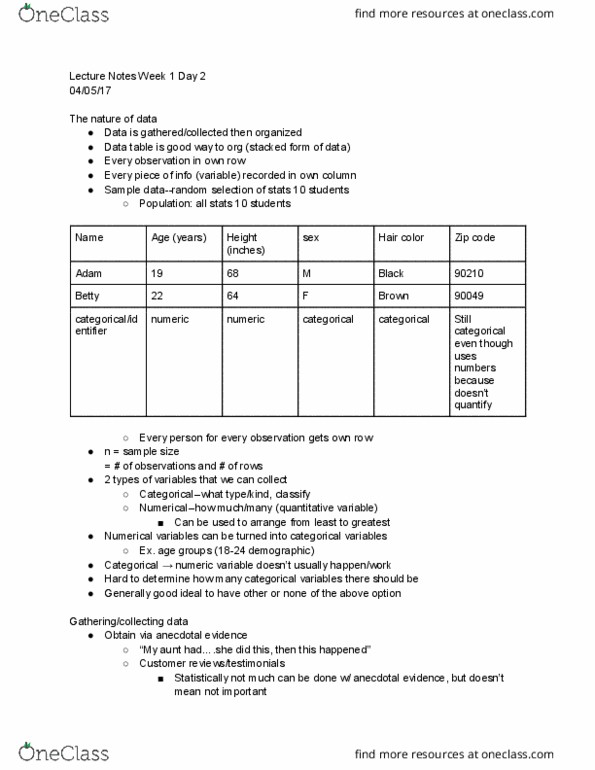
Variables : numbers or quantities that can be measured or counted. Observations : occurrence of a specific variable recorded about a data unit. Variables are often organized in columns, observations in rows. Population : collection of observations of interest; generally huge and impossible to measure. Sample : portion of the population that is taken to measure a characteristic. Numerical : quantitative items that are recorded by numbers, e. g. height. Categorical : qualitative items that can be coded with numbers but requires a key, such as name or eye color. It is very important to understand context as once you do, you can determine whether a variable is numerical or categorical. Frequency / count : natural way to summarize the categorical variables (how often an item occurs). Two-way tables : displays frequency of two categorical variables conditional to each other. Usually has both axes labeled, one axis per categorical variable. Also typically has totals at the end of each axis.