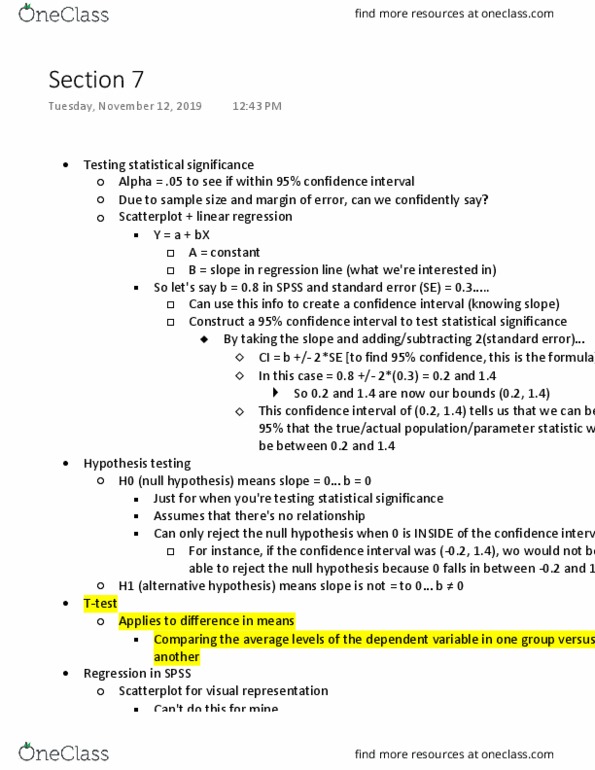
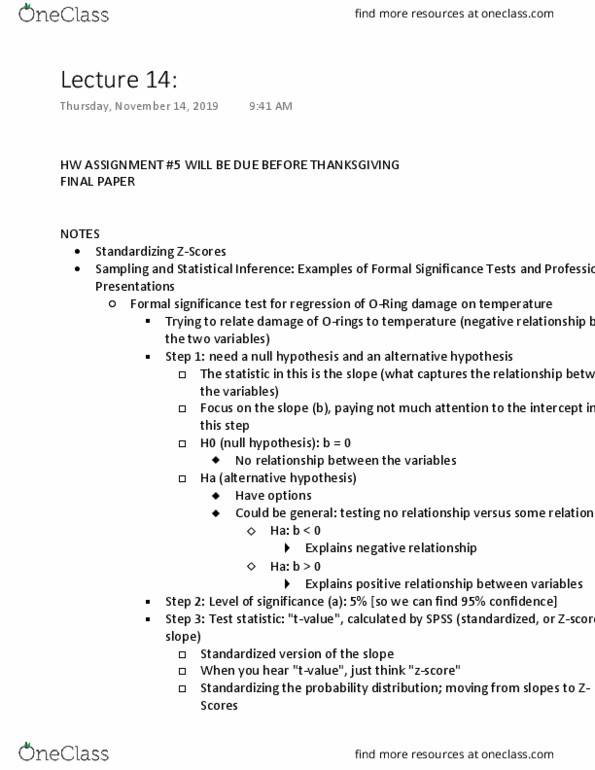
POL S 15 Lecture Notes - Lecture 8: Confidence Interval, Coefficient Of Determination, Null Hypothesis

Document Summary
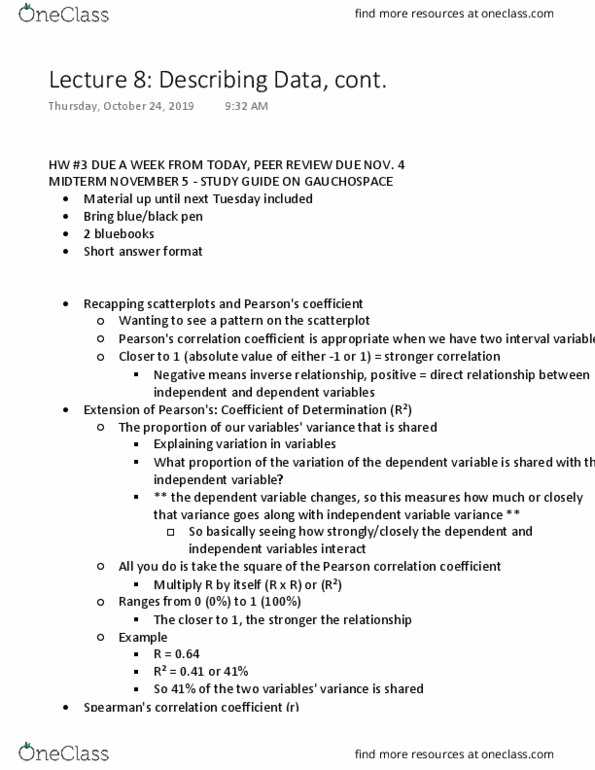
R squared - tells how much of a variation in dependent variable is being explained by independent variables. Y = a + bx (basic regression equation with one independent variable) Multivariate: y = a + b1x + b2x + b3x Now this model predicts 3 "slopes" for each independent variable. Trying to predict [dependent variable] based on [constant] + [independent variable. If we have values for independent variables, we can use this regression to predict what the dependent variable will be. Trying to assess whether independent variable affects dependent. Look at b (slope) and b (constant) from table --> fill out equation y = a + bx. Substantive significance: how big is the slope, steep slope suggests a strong relationship between variables (closer to 1) Start off with the assumption that there is no relationship between variables. Test against alternative hypothesis using our data (ha) Create a critical level of confidence a = 0. 05 (95% confidence)