AMS 5 Lecture Notes - Lecture 8: Scatter Plot, Ellipse

29 Apr 2017
School
Department
Course
Professor


50
AMS 5 Full Course Notes
Verified Note
50 documents
Document Summary
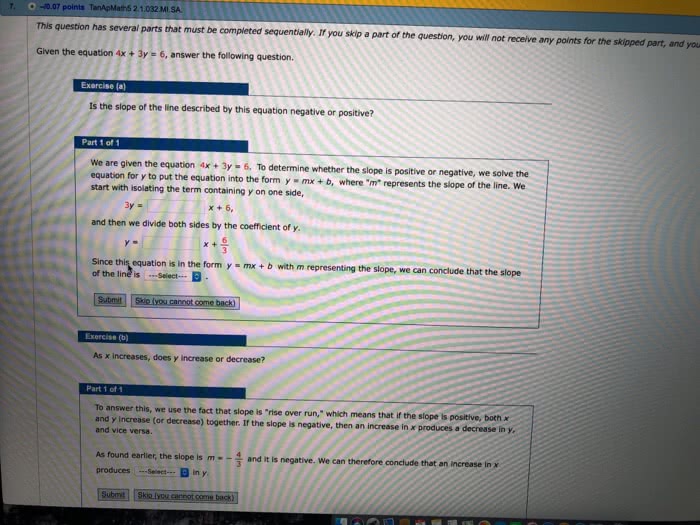
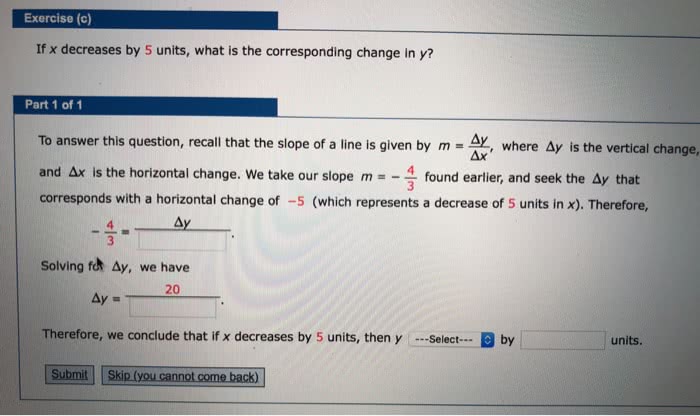
These equations come in several forms, for example: ax + by = c, y = y(0) + m(x-x(0), y = mx + b, the slope of a line is the ratio: y(1) y(0) x(1) x(0) In equations (ii) and (iii) above, the slope is given by m. change in y change in x rise run: the slope (m is the amount by which y changes if x changes by one unit. In other words: change in y =1 y y(0) = m(x-x(0) = m. We"re trying to make the vertical distance to the line we"re going to draw as small as possible. A: the regression line predicts that on average, they would have weighed about. A: so, the average weight for these women would have been about 140 lbs. a, question: by how much did average weight increase for every 1 inch in height, answer: 1 inch represents.