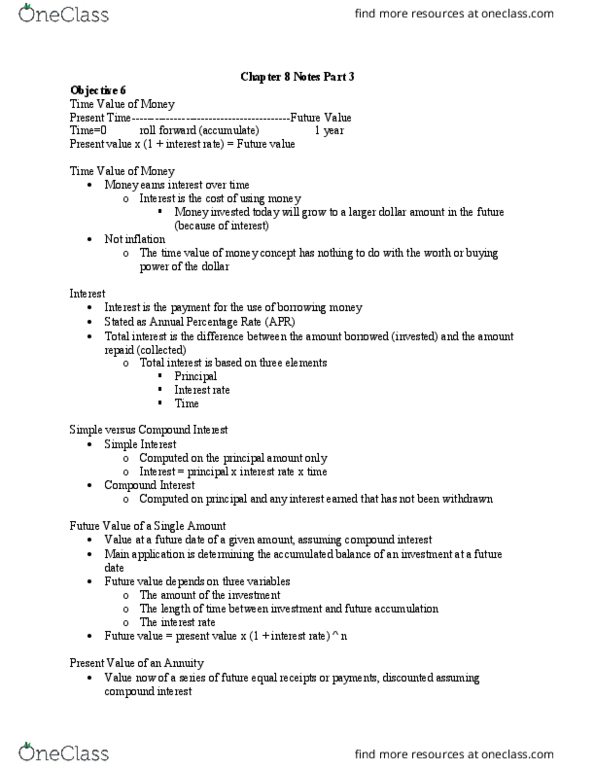
ACG 2021 Lecture 9: defferals accounting basics


This preview shows page 1 of the document.
Unlock all 3 pages and 3 million more documents.
Get access


Related Documents
Related Questions
The income statement, balance sheets, and additional informationfor Great Adventures, Inc., are provided below. |
| GREAT ADVENTURES, INC. Income Statement For the year ended December 31, 2014 | ||||
| Revenues: | ||||
| Servicerevenue (clinic, racing, TEAM) | $ | 564,000 | ||
| Sales revenue(MU watches) | 131,000 | |||
| Total revenues | $ | 695,000 | ||
| Expenses: | ||||
| Cost of goodssold (watches) | 69,100 | |||
| Operatingexpenses | 294,276 | |||
| Depreciationexpense | 48,900 | |||
| Interestexpense | 23,181 | |||
| Income taxexpense | 56,400 | |||
| Totalexpenses | 491,857 | |||
| Net income | $ | 203,143 | ||
| GREAT ADVENTURES, INC. Balance Sheet December 31, 2014 and 2013 | |||||||||
| 2014 | 2013 | Increase (I) or Decrease (D) | |||||||
| Assets | |||||||||
| Current assets: | |||||||||
| Cash | $ | 464,424 | $ | 147,980 | $ | 316,444 | (I) | ||
| Accounts receivable | 44,200 | 34,100 | 10,100 | (I) | |||||
| Inventory | 16,600 | 12,800 | 3,800 | (I) | |||||
| Other current assets | 12,500 | 9,300 | 3,200 | (I) | |||||
| Long-termassets: | |||||||||
| Land | 493,000 | 0 | 493,000 | (I) | |||||
| Buildings | 1,000,000 | 0 | 1,000,000 | (I) | |||||
| Equipment | 63,900 | 63,900 | |||||||
| Accumulated depreciation | (74,450) | (25,550) | 48,900 | (I) | |||||
| Total assets | $ | 2,020,174 | $ | 242,530 | |||||
| Liabilities and Stockholders'Equity | |||||||||
| Currentliabilities: | |||||||||
| Accounts payable | $ | 13,200 | $ | 10,900 | $ | 2,300 | (I) | ||
| Interest payable | 930 | 930 | |||||||
| Income tax payable | 57,400 | 38,000 | 19,400 | (I) | |||||
| Long-termliabilities: | |||||||||
| Notes payable | 401,801 | 31,900 | 369,901 | (I) | |||||
| Stockholders'Equity: | |||||||||
| Common stock | 118,000 | 19,000 | 99,000 | (I) | |||||
| Paid-in capital | 1,291,900 | 0 | 1,291,900 | (I) | |||||
| Retained earnings | 231,943 | 141,800 | 90,143 | (I) | |||||
| Treasury stock | (95,000) | 0 | (95,000) | (I) | |||||
| Total liabilitiesand stockholders | |||||||||

Alta Ski Company's inventory records contained the following information regarding its latest ski model. The company uses a periodic inventory system.
| Beginning inventory, January 1, 2018 | 1,250 | units @ $90 each | |||||||||||||||||||||||||||||||||||||||||||||||||||||||||||||||||||||||||||||||||||||||||||||||||||||||||||||||||||||||||||||||||||||||||||||||||||||||||
| Purchases: | |||||||||||||||||||||||||||||||||||||||||||||||||||||||||||||||||||||||||||||||||||||||||||||||||||||||||||||||||||||||||||||||||||||||||||||||||||||||||||
| January 15 | 2,600 | units @ $105 each | |||||||||||||||||||||||||||||||||||||||||||||||||||||||||||||||||||||||||||||||||||||||||||||||||||||||||||||||||||||||||||||||||||||||||||||||||||||||||
| January 21 | 2,400 | units @ $110 each | |||||||||||||||||||||||||||||||||||||||||||||||||||||||||||||||||||||||||||||||||||||||||||||||||||||||||||||||||||||||||||||||||||||||||||||||||||||||||
| Sales: | |||||||||||||||||||||||||||||||||||||||||||||||||||||||||||||||||||||||||||||||||||||||||||||||||||||||||||||||||||||||||||||||||||||||||||||||||||||||||||
| January 5 | 1,200 | units @ $130 each | |||||||||||||||||||||||||||||||||||||||||||||||||||||||||||||||||||||||||||||||||||||||||||||||||||||||||||||||||||||||||||||||||||||||||||||||||||||||||
| January 22 | 1,600 | units @ $140 each | |||||||||||||||||||||||||||||||||||||||||||||||||||||||||||||||||||||||||||||||||||||||||||||||||||||||||||||||||||||||||||||||||||||||||||||||||||||||||
| January 29 | 1,050 | units @ $145 each | |||||||||||||||||||||||||||||||||||||||||||||||||||||||||||||||||||||||||||||||||||||||||||||||||||||||||||||||||||||||||||||||||||||||||||||||||||||||||
| Ending inventory, January 31, 2018 | 2,400 | units | |||||||||||||||||||||||||||||||||||||||||||||||||||||||||||||||||||||||||||||||||||||||||||||||||||||||||||||||||||||||||||||||||||||||||||||||||||||||||
| Compute cost of goods sold for January and the ending inventory using both the FIFO and LIFO methods. Please fill in the answer in all the spaces I put an "A" in. Will give good feedback, thanks!
| |||||||||||||||||||||||||||||||||||||||||||||||||||||||||||||||||||||||||||||||||||||||||||||||||||||||||||||||||||||||||||||||||||||||||||||||||||||||||||

CurrentAssets trend 12/31/2015 12/31/2014 | $change%change | ||||||||||||||||||||||||||||||||
Cash and Cash Equivalents | $4,907,000 | $4,315,000 | ||||||||||||||||||||||||||||||
Short-Term Investments | $13,527,000 | $6,884,000 | ||||||||||||||||||||||||||||||
Net Receivables | $2,559,000 | $1,678,000 | ||||||||||||||||||||||||||||||
Inventory | $0 | $0 | ||||||||||||||||||||||||||||||
Other Current Assets | $659,000 | $513,000 | ||||||||||||||||||||||||||||||
Total Current Assets | $21,652,000 | $13,390,000 | ||||||||||||||||||||||||||||||
Long-Term Assets | ||||||||||||||||||||||||||||||||
Long-Term Investments | $0 | $0 | ||||||||||||||||||||||||||||||
Fixed Assets | $5,687,000 | $3,967,000 | ||||||||||||||||||||||||||||||
Goodwill | $18,026,000 | $17,981,000 | ||||||||||||||||||||||||||||||
Intangible Assets | $3,246,000 | $3,929,000 | ||||||||||||||||||||||||||||||
Other Assets | $796,000 | $699,000 | ||||||||||||||||||||||||||||||
Deferred Asset Charges | $0 | $0 | ||||||||||||||||||||||||||||||
Total Assets | $49,407,000 | $39,966,000 | ||||||||||||||||||||||||||||||
Current Liabilities | ||||||||||||||||||||||||||||||||
Accounts Payable | $1,645,000 | $1,042,000 | ||||||||||||||||||||||||||||||
Short-Term Debt / Current Portion of Long-TermDebt | $224,000 | $316,000 | ||||||||||||||||||||||||||||||
Other Current Liabilities | $56,000 | $66,000 | ||||||||||||||||||||||||||||||
Total Current Liabilities | $1,925,000 | $1,424,000 | ||||||||||||||||||||||||||||||
Long-Term Debt | $107,000 | $119,000 | ||||||||||||||||||||||||||||||
Other Liabilities | $3,157,000 | $2,327,000 | ||||||||||||||||||||||||||||||
Deferred Liability Charges | $0 | $0 | ||||||||||||||||||||||||||||||
Misc. Stocks | $0 | $0 | ||||||||||||||||||||||||||||||
Minority Interest | $0 | $0 | ||||||||||||||||||||||||||||||
Total Liabilities | $5,189,000 | $3,870,000 | ||||||||||||||||||||||||||||||
Stock Holders Equity | ||||||||||||||||||||||||||||||||
Common Stocks | $0 | $0 | ||||||||||||||||||||||||||||||
Capital Surplus | $34,886,000 | $30,225,000 | ||||||||||||||||||||||||||||||
Retained Earnings | $9,787,000 | $6,099,000 | ||||||||||||||||||||||||||||||
Treasury Stock | $0 | $0 | ||||||||||||||||||||||||||||||
Other Equity | ($455,000) | ($228,000) | ||||||||||||||||||||||||||||||
Total Equity | $44,218,000 | $36,096,000 | ||||||||||||||||||||||||||||||
Total Liabilities & Equity | $49,407,000 | $39,966,000 | ||||||||||||||||||||||||||||||
what would be the horizontal analyisis and the vertical analysisand what do i need to do the ratio analysis
