ECON 103 Lecture Notes - Lecture 3: Aggregate Demand, Aggregate Supply, Stagflation

6 Nov 2016
School
Department
Course
Professor
Document Summary
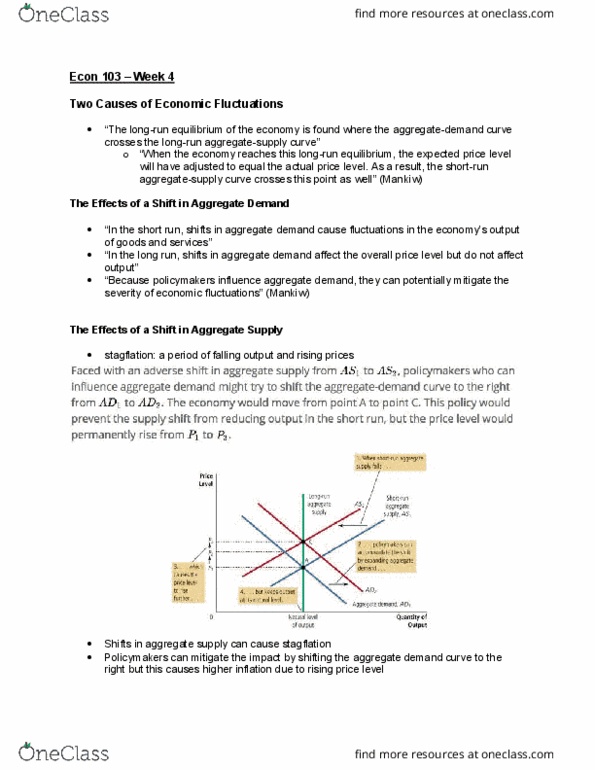
Model of aggregate demand and aggregate supply: the model that most economists use to explain short-run fluctuations in economic activity around its long-run trend. Same with converse (increase in price level = decrease in quantity of goods & services demanded) Aggregate-supply curve: a curve that shows the quantity of goods and services that firms choose to produce and sell at each price level. Recall gdp formula: (cid:1851)=+++(cid:1850) (y = yield, c = consumption, i = which is (cid:1857)(cid:1872) (cid:1857)(cid:1876)(cid:1868)(cid:1867)(cid:1870)(cid:1872)=(cid:1876)(cid:1868)(cid:1867)(cid:1870)(cid:1872) (cid:1865)(cid:1868)(cid:1867)(cid:1870)(cid:1872) Wealth effect: when price level falls, currency value rises in value and increases investments also including inventory, g = government spending, nx = net export, real wealth of consumers, allowing them to purchase more goods. Same with converse (increase in price level = decrease in currency value) Interest-rate effect: lower price level reduces interest rate, thus encouraging investment & increasing quantity of goods & services demanded.