GEOG 371 Lecture Notes - Lecture 2: Choropleth Map, Interquartile Range, Squared Deviations From The Mean

15 Feb 2018
School
Department
Course
Professor
Document Summary
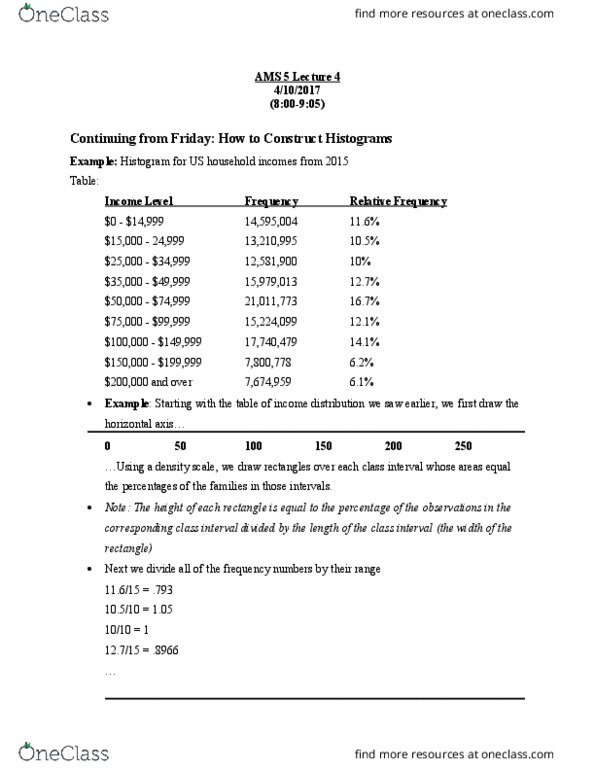
Exploring spatial data: nominal data, bar graph, pie chart, etc. Interval data: histogram, frequency polygon, stem-leaf plot. Histogram: x axis value ranges (also called bins/ class intervals, bins should be same width, except at extremes of data (highest and/or lowest bins, y axis frequency, # of observations w/ a particular value range. Mapping concepts: choropleth map areas shaded according to values, methods for determining class intervals, equal intervals based on range, equal intervals not based on range. Review of measures of central tendency: mode most frequent value (nominal/ ordinal data, mean, median. Mean (avg: properties, sum of deviations (cid:4666) (cid:4667) around mean = 0 n, least squares property sum of squared deviations minimized at mean value i . 1 n: xi = value of variable x for observation i, n = # of observations. Median: middle value of ranked xi values, property minimizes sum of absolute deviations. If even # of values, median = midpoint of middle 2 values.