FIN 357 Lecture Notes - Lecture 2: Accounting Liquidity, Operating Cash Flow, Tax Bracket

Document Summary
Get access


Related Documents
Related Questions

What are the Market Value Leverage Ratios (Value of Debt to Value of Equity, Value of Debt to Value of Assets)) for the following 2015 and 2016 financial data? (PLEASE SHOW WORK SO I CAN UNDERSTAND HOW THIS WAS DONE. Thank you)
| AMAZON.COM INC (AMZN) CashFlowFlag INCOME STATEMENT | ||
| Fiscal year ends in December. USD in millions except per share data. | 2015-12 | 2016-12 |
| Revenue | 107006 | 135987 |
| Cost of revenue | 71651 | 88265 |
| Gross profit | 35355 | 47722 |
| Operating expenses | ||
| Sales, General and administrative | 20411 | 27284 |
| Other operating expenses | 12711 | 16252 |
| Total operating expenses | 33122 | 43536 |
| Operating income | 2233 | 4186 |
| Interest Expense | 459 | 484 |
| Other income (expense) | -206 | 190 |
| Income before income taxes | 1568 | 3892 |
| Provision for income taxes | 950 | 1425 |
| Other income | -22 | -96 |
| Net income from continuing operations | 596 | 2371 |
| Net income | 596 | 2371 |
| Net income available to common shareholders | 596 | 2371 |
| Earnings per share | ||
| Basic | 1.28 | 5.01 |
| Diluted | 1.25 | 4.9 |
| Weighted average shares outstanding | ||
| Basic | 467 | 474 |
| Diluted | 477 | 484 |
| EBITDA | 8308 | 12492 |
| AMAZON.COM INC (AMZN) CashFlowFlag BALANCE SHEET | ||
| Fiscal year ends in December. USD in millions except per share data. | 2015-12 | 2016-12 |
| Assets | ||
| Current assets | ||
| Cash | ||
| Cash and cash equivalents | 15890 | 19334 |
| Short-term investments | 3918 | 6647 |
| Total cash | 19808 | 25981 |
| Receivables | 6423 | 8339 |
| Inventories | 10243 | 11461 |
| Deferred income taxes | ||
| Total current assets | 36474 | 45781 |
| Non-current assets | ||
| Property, plant and equipment | ||
| Land | 9770 | 13998 |
| Fixtures and equipment | 18417 | 25989 |
| Other properties | 1866 | 2454 |
| Property and equipment, at cost | 30053 | 42441 |
| Accumulated Depreciation | -8215 | -13327 |
| Property, plant and equipment, net | 21838 | 29114 |
| Goodwill | 3759 | 3784 |
| Intangible assets | ||
| Deferred income taxes | 1084 | |
| Other long-term assets | 2289 | 4723 |
| Total non-current assets | 28970 | 37621 |
| Total assets | 65444 | 83402 |
| Liabilities and stockholders' equity | ||
| Liabilities | ||
| Current liabilities | ||
| Accounts payable | 20397 | 25309 |
| Accrued liabilities | 10384 | 13739 |
| Deferred revenues | 3118 | 4768 |
| Total current liabilities | 33899 | 43816 |
| Non-current liabilities | ||
| Long-term debt | 8235 | 7694 |
| Capital leases | 5948 | 7519 |
| Deferred taxes liabilities | 392 | |
| Other long-term liabilities | 3978 | 4696 |
| Total non-current liabilities | 18161 | 20301 |
| Total liabilities | 52060 | 64117 |
| Stockholders' equity | ||
| Common stock | 5 | 5 |
| Additional paid-in capital | 13394 | 17186 |
| Retained earnings | 2545 | 4916 |
| Treasury stock | -1837 | -1837 |
| Accumulated other comprehensive income | -723 | -985 |
| Total stockholders' equity | 13384 | 19285 |
| Total liabilities and stockholders' equity | 65444 | 83402 |
| AMAZON.COM INC (AMZN) Statement of CASH FLOW | ||
| Fiscal year ends in December. USD in millions except per share data. | 2015-12 | 2016-12 |
| Cash Flows From Operating Activities | ||
| Net income | 596 | 2371 |
| Depreciation & amortization | 6281 | 8116 |
| Investments losses (gains) | 5 | |
| Deferred income taxes | 81 | -246 |
| Stock based compensation | 2119 | 2975 |
| Accounts receivable | -1755 | -3367 |
| Inventory | -2187 | -1426 |
| Accounts payable | 4294 | 5030 |
| Accrued liabilities | 913 | 1724 |
| Other working capital | 1292 | 1955 |
| Other non-cash items | 281 | -689 |
| Net cash provided by operating activities | 11920 | 16443 |
| Cash Flows From Investing Activities | ||
| Investments in property, plant, and equipment | -4589 | -6737 |
| Acquisitions, net | -795 | -116 |
| Purchases of investments | -4091 | -7756 |
| Sales/Maturities of investments | 3025 | 4733 |
| Net cash used for investing activities | -6450 | -9876 |
| Cash Flows From Financing Activities | ||
| Long-term debt issued | 353 | 621 |
| Long-term debt repayment | -4235 | -4361 |
| Excess tax benefit from stock based compensation | 119 | 829 |
| Repurchases of treasury stock | ||
| Net cash provided by (used for) financing activities | -3763 | -2911 |
| Effect of exchange rate changes | -374 | -212 |
| Net change in cash | 1333 | 3444 |
| Cash at beginning of period | 14557 | 15890 |
| Cash at end of period | 15890 | 19334 |
| Free Cash Flow | ||
| Operating cash flow | 11920 | 16443 |
| Capital expenditure | -4589 | -6737 |
| Free cash flow | 7331 | 9706 |
| Supplemental schedule of cash flow data | ||
| Cash paid for income taxes | 273 | 412 |
| Cash paid for interest | 478 | 496 |

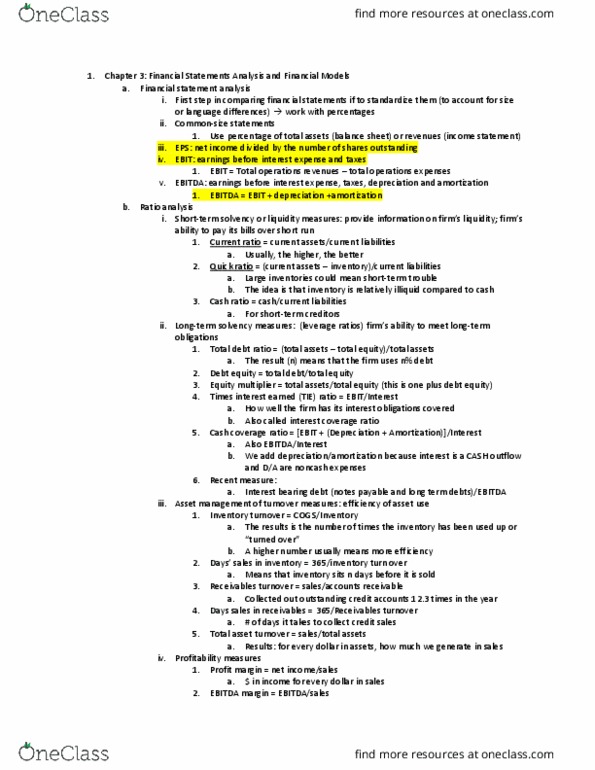
1. Use the attached balance sheet and income statement to compute the required financial ratios for 2012. Use 360 for the number of days in a year. The computations for 2011 are already done for you.
Current ratio_________________________
Quick ratio__________________________
Inventor turnover____________________
Average Collection Period_____________
Total asset turnover__________________
Net profit margin____________________
Operating profit margin_______________
Times Interest Earned_________________
Debt/Net Worth Ratio_________________
Return on Equity ratio__________________
2. Using the computed financial ratios from question 1, compare Grounds Keeperâs performance from 2011 to 2012. Address what areas the company has improved and what areas it has not
A.)Liquidity
B.) Activity / turnover / efficiency
C.) Profitability
D.) Leverage / use of debt / solvency
3. If you were the CEO of Grounds Keeper, what area(s) would you concentrate on to improve the performance of the company?
4. Define the terms capital structure, cost of capital, and working capital. Focus on how they are different from each other and impact both profitability and risk.
5. Determine Grounds Keeperâs capital structure and working capital.
6. If Grounds Keeper has a required rate of return on its long-term debt of 9% (before taxes) and a required rate of return on its common stock, a tax rate of 40%, what is its weighted average cost of capital (WACC) for 2012? How could Grounds Keeper lower its WACC? (HINT: you will need to look at the balance sheet to determine the weight of debt to equity.
7. What are the advantages to Grounds Keeper in using money market instruments as financing? How does this related to financing net working capital?
8. Explain what Grounds Keeper should consider when deciding whether to issue stocks or bonds? Answer using at least 3 different characteristics comparing and contrasting stocks and bonds.
9. Define money market instruments; list at least one type of security that would be considered a money market instrument. What are the advantages to Grounds Keeper in using money market instruments as financing? What are the disadvantages?
| Grounds Keeper | ||
| Consolidated Balance Sheets | ||
| (Dollars in thousands) | ||
| 2012 | 2011 | |
| Assets | ||
| Current assets: | ||
| Cash and cash equivalents | 78,240 | 44,395 |
| Receivables | 399,891 | 340,062 |
| Inventories | 844,737 | 736,677 |
| Total current assets | 1,322,868 | 1,121,133 |
| Fixed assets, net | 1,244,384 | 889,613 |
| Other long-term assets | 1,048,537 | 1,187,141 |
| Total assets | 3,615,789 | 3,197,887 |
| Liabilities and Stockholdersâ Equity | ||
| Current liabilities: | ||
| Accounts payable | 309,222 | 319,465 |
| Accruals | 201,017 | 145,240 |
| Notes payable | 9,748 | 6,669 |
| Total current liabilities | 519987 | 471374 |
| Long-term debt | 834574 | 814298 |
| Total liabilities | 1,354,561 | 1,285,672 |
| Stockholdersâ equity: | ||
| Common stock, $0.10 par value: | 15,268 | 15,447 |
| Additional paid-in capital | 1,464,560 | 1,499,616 |
| Retained earnings | 781400 | 397152 |
| Total stockholdersâ equity | 2,261,228 | 1,912,215 |
| Total liabilities and stockholdersâ equity | 3,615,789 | 3,197,887 |
| Grounds Keeper | |||||
| Consolidated Statements of Operations | |||||
| (Dollars in thousands except per share data) | |||||
| 2011 | ||||
| Net sales | 3,889,426 | 2,642,390 | |||
| Cost of sales | 2,589,799 | 1,746,274 | |||
| Gross profit | 1,299,627 | 896,116 | |||
| Selling and operating expenses | 481,493 | 348,696 | |||
| General and administrative expenses | 219,010 | 187,016 | |||
| Operating income | 599,124 | 360,404 | |||
| Interest expense | 22,983 | 57,657 | |||
| Income before income taxes | 576,141 | 302,747 | |||
| Income tax expense | 212,641 | 101,699 | |||
| Net Income | 363,500 | 201,048 | |||
| Basic income per share: | |||||
| Average shares outstanding | 154,933,948 | 146,214,860 | |||
| Earnings per common share | 2.35 | 1.38 |
| Current Ratio | Current assets/ Current liabilities |
| Quick Ratio | Current assets â inventory/ Current liabilities |
| Inventory Turnover | Cost of goods sold/ Inventory |
| Receivables Turnover | Sales/ Accounts receivables |
| Average Collection Period | Receivables/ Sales per day |
| Fixed Asset Turnover | Sales/ Fixed assets |
| Total Asset Turnover | Sales/ Total Assets |
| Gross Profit Margin | Revenues - Cost of goods sold/ Sales |
| Operating Profit Margin | Earnings before interest and taxes/ Sales |
| Net Profit Margin | Net income/ Sales |
| Return on Total Assets | Net income/ Total assets |
| Debt/Net Worth Ratio | Total Debt/ Total Equity |
| Times-Interest-Earned | Operating Income/ Interest expense |
| Return on Equity | Net income/ Total equity |
