SDS 306 Lecture Notes - Lecture 5: Linkedin

25 Jan 2017
School
Department
Course
Professor
Document Summary
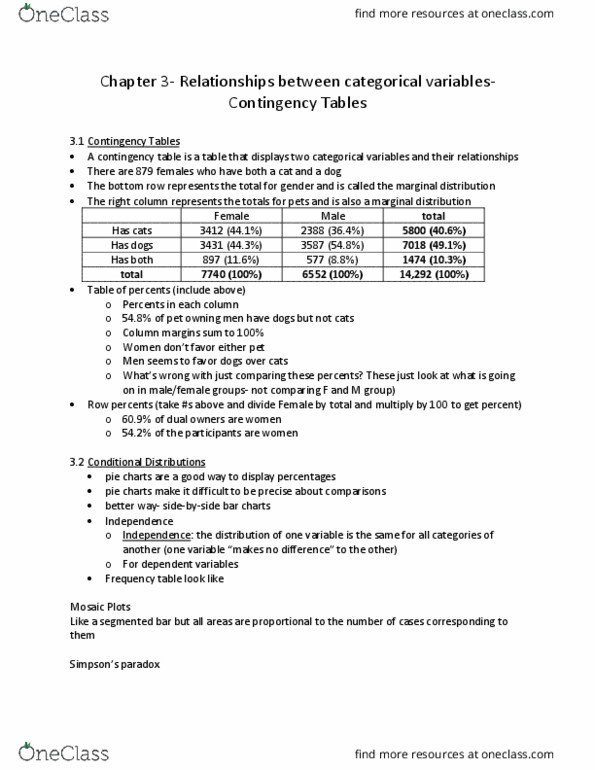
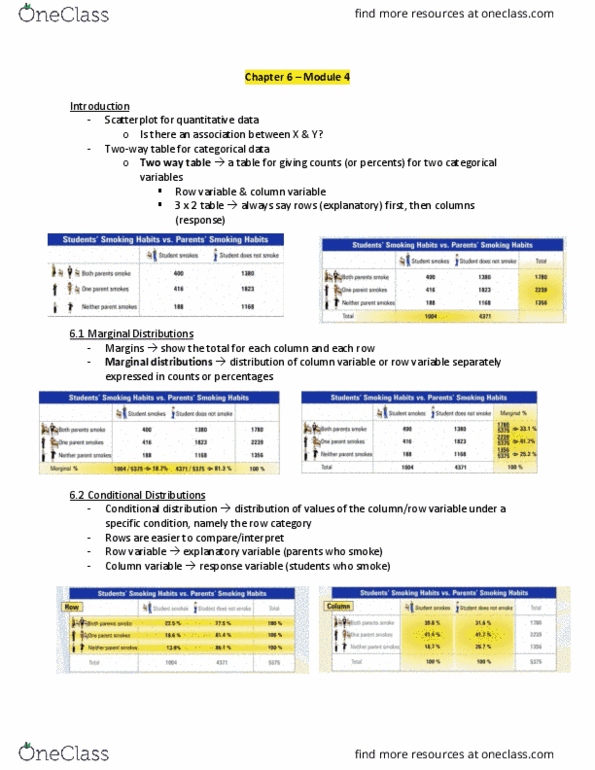
Provides the percentages of the categories of one variable within one category of the second variable. Percent in a cell is based on either: its percent out of the row total, its percent out of the column total. The condition can either be based on rows or columns. This table shows that the highest percent of survivors were crew members. The highest percent of the dead were also crew members. Pie charts can give a visual representation of the conditional distributions. Compare how the first- class ticket holders were represented among the survivors vs. the dead. Bar charts can also effectively tell the story for conditional distributions. Compare the conditional distributions of one variable. If independent: the conditional distribution of one variable is the same across all categories of the other variable. If not independent: the conditional distributions are different, then there is an association between the two variables, that is, one variable influences the other variable.