QMB-210 Lecture Notes - Lecture 2: Ratio, Mobile App, Percentile

28 Oct 2017
School
Department
Course
Professor
Document Summary
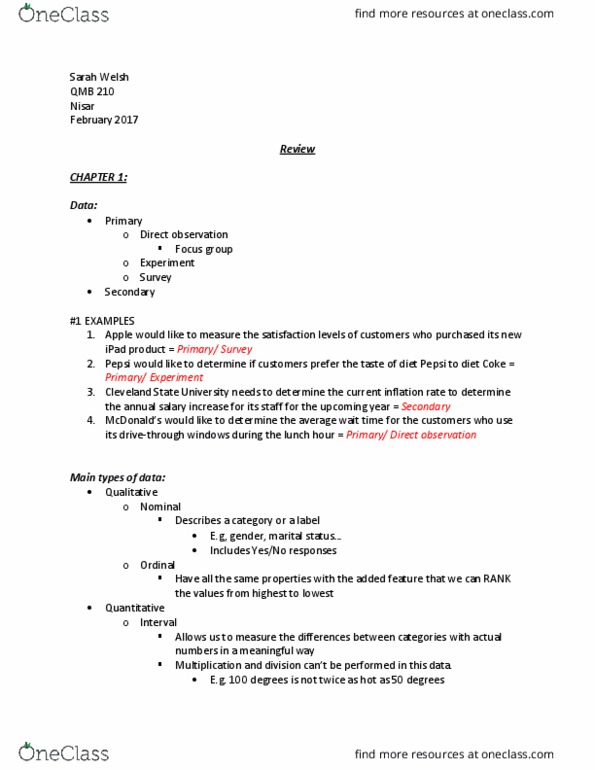
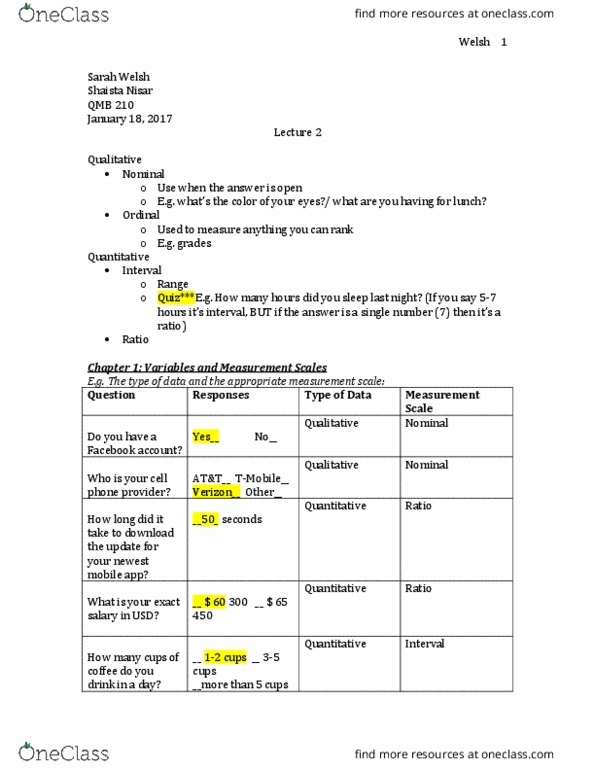
Primary data collection: get info directly from source, i have reached out to source. Secondary data collection: when someone else collects the data i"m using. Secondary: mcdoanld"s would like to determine the average wait time for customers who use drive-through windows during the lunch hour- primary: Please identify the type of data and the appropriate measurement scale: What is the average score of students in. Create a new column next to one you want to split. Then click other and type in from where you want to split up the sentence. You want fl in column alone, so put * in other to separate after tampa. Eg each one says madison county, jefferson county, etc. ** slide 28 on powerpoint = very important. Pareto chart (decreasing order w cumulative frequency) Pie chart (used when dealing with % - circle) Minimize it, and go onto phstat on desktop. One way table and charts way down.