ZXY Company is a food product company. ZXY is considering expanding to two new products and a second production facility. The food products are staples with steady demands. The proposed expansion will require an investment of $7,000,000 for equipment with an assumed ten-year life, after which all equipment and other assets can be sold for an estimated $1,000,000. They will be renting the facility. ZXY requires a 12 percent return on investments. You have been asked to recommend whether or not to make the investment.
In preparing and supporting your recommendation to either make the investment or not, include the following items as part of your analysis:
Analysis of financial information.
Identification of risks associated with the investment. Consider:
How risky the project appears.
How far off your estimates of revenues and expenses can be before your decision would change.
The difference if the company were to use a straight line versus a MACRS depreciation.
Recommendation for a course of action.
Explanation of criteria supporting your recommendation
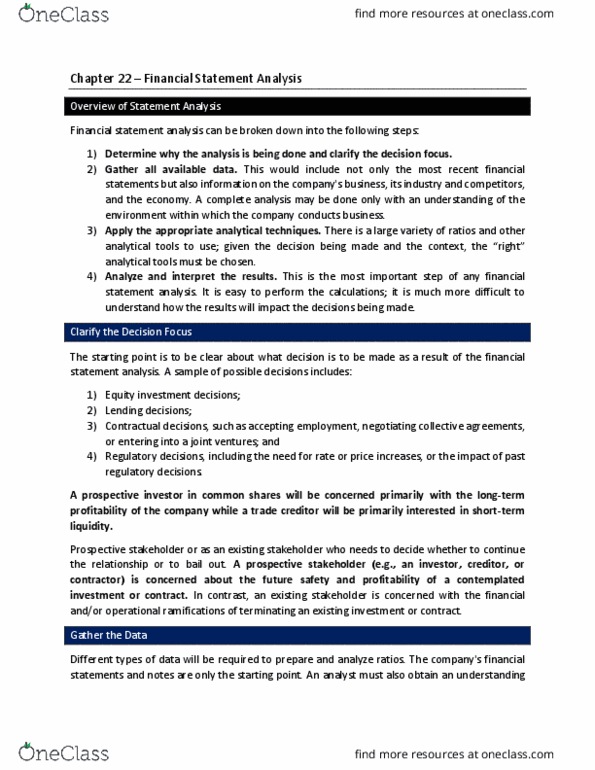
FINANCIAL STATEMENTS
ZXY - Forecast Ten Years Pro-Forma Income Statement Year 1 Year 2 Year 3 Year 4 Year 5 Year 6 Year 7 Year 8 Year 9 Year 10 Total Brand new Acme System - full system Income Revenue Product A 2,400,000 2,800,000 2,800,000 3,240,000 3,900,000 3,900,000 3,900,000 3,900,000 3,900,000 3,900,000 34,640,000 Product B 900,000 1,350,000 2,500,000 3,000,000 4,000,000 4,950,000 5,500,000 22,200,000 Total · Revenue 2,400,000 2,800,000 2,800,000 4,140,000 5,250,000 6,400,000 6,900,000 7,900,000 8,850,000 9,400,000 56,840,000 Cost of Goods Sold Pest Control 50,000 66,550 73,205 73,205 73,205 73,205 73,205 73,205 73,205 73,205 702,190 SQF FDA mandates 90,000 90,000 90,000 90,000 90,000 30,000 30,000 30,000 30,000 30,000 600,000 Rent - Plant 400,000 408,000 416,160 424,483 432,973 441,632 450,465 459,474 468,664 478,037 4,379,888 Plant Equip. - Fklf - Scrb/Lease 40,000 64,000 64,000 64,000 64,000 64,000 64,000 64,000 64,000 64,000 616,000 Plant Equip. - Ongoing maintenance 50,000 70,000 75,000 75,000 75,000 75,000 75,000 75,000 75,000 75,000 720,000 Plant Equip. - Parts 40,000 50,000 50,000 50,000 50,000 50,000 50,000 50,000 50,000 50,000 490,000 Miscellaneous - Equipment 15,000 15,000 15,000 15,000 15,000 15,000 15,000 15,000 15,000 15,000 150,000 Building repairs 25,000 25,000 25,000 25,000 25,000 25,000 25,000 25,000 25,000 25,000 250,000 Plant supplies 100,000 120,000 144,000 109,808 120,789 132,868 146,154 160,770 176,847 194,532 1,405,767 Plant Utilities 120,000 210,000 240,000 240,000 240,000 240,000 240,000 240,000 240,000 240,000 2,250,000 Garbage removal/Janitorial 30,000 45,626 52,470 52,470 52,470 52,470 52,470 52,470 52,470 52,470 495,388 Plant telephone 7,200 7,200 7,200 7,200 7,200 7,200 7,200 7,200 7,200 7,200 72,000 Plant payroll expense 495,000 675,000 825,000 885,000 915,000 975,000 1,005,000 1,065,000 1,095,000 1,125,000 9,060,000 Health Benefits 45,360 97,200 105,000 100,000 100,000 100,000 100,000 100,000 100,000 100,000 947,560 WC & P/R Expense 59,400 81,000 99,000 106,200 109,800 117,000 120,600 127,800 131,400 135,000 1,087,200 Installation/Additional Equipment 250,000 - 200,000 - - - - - - - 450,000 Total COGS 1,816,960 2,024,576 2,481,035 2,317,366 2,370,437 2,398,375 2,454,095 2,544,919 2,603,786 2,664,444 23,675,993 Gross Profit 583,040 775,424 318,965 1,822,634 2,879,563 4,001,625 4,445,905 5,355,081 6,246,214 6,735,556 33,164,007 Expenses Other than GOGS Liability Insurance 60,000 91,253 104,940 104,940 104,940 104,940 104,940 104,940 104,940 104,940 990,776 Bank Service Charges 1,500 1,500 1,500 1,500 1,500 1,500 1,500 1,500 1,500 1,500 15,000 Interest on debt 90,627 187,626 232,323 206,766 166,740 122,959 75,071 31,993 7,539 111 1,121,754 Incentive Plan 13,200 16,500 16,500 16,500 16,500 16,500 16,500 16,500 16,500 145,200 Management 180,000 180,000 180,000 180,000 180,000 190,000 190,000 190,000 190,000 190,000 1,850,000 Workers Comp./P/R Taxes 21,600 21,600 21,600 21,600 21,600 22,800 22,800 22,800 22,800 22,800 222,000 Health Insurance Benefit 4,200 5,082 5,590 5,590 5,590 5,590 5,590 5,590 5,590 5,590 54,004 Office/Administrative Expenses 12,000 15,972 17,569 17,569 17,569 17,569 17,569 17,569 17,569 17,569 168,526 Legal and Professional - Tax 30,000 10,000 10,000 10,000 10,000 10,000 10,000 10,000 10,000 10,000 120,000 Cellular phones 5,000 5,000 5,000 5,000 5,000 5,000 5,000 5,000 5,000 5,000 50,000 Internet Services 4,400 5,856 6,442 6,442 6,442 6,442 6,442 6,442 6,442 6,442 61,793 Postage & Delivery 1,100 1,464 1,611 1,611 1,611 1,611 1,611 1,611 1,611 1,611 15,448 Office supplies 11,000 9,983 10,981 10,981 10,981 10,981 10,981 10,981 10,981 10,981 108,829 Employee Food & Beverage 1,100 1,464 1,611 1,611 1,611 1,611 1,611 1,611 1,611 1,611 15,448 Local/Business Taxes 1,100 1,464 1,611 1,611 1,611 1,611 1,611 1,611 1,611 1,611 15,448 Property Taxes 12,000 15,000 15,000 15,000 15,000 15,000 15,000 15,000 15,000 15,000 147,000 Travel - Equip. Consultants 25,000 16,500 16,500 16,500 16,500 16,500 16,500 16,500 16,500 16,500 173,500 Licenses and Permits 10,000 10,000 10,000 10,000 10,000 10,000 10,000 10,000 10,000 10,000 100,000 Total Expense 470,627 592,964 658,777 633,220 593,194 560,613 512,725 469,647 445,193 437,765 5,374,724 Net Income before Depreciation 112,413 182,460 (339,812) 1,189,413 2,286,369 3,441,012 3,933,181 4,885,434 5,801,021 6,297,791 27,789,282 Depreciation Expense ( 185,770 504,140 652,915 573,415 409,635 325,725 299,025 240,970 124,955 33,450 3,350,000 Tax Expense - - - - 99,961 934,586 1,090,247 1,393,339 1,702,820 1,879,302 7,100,255 Net Income (73,357) (321,680) (992,727) 615,998 1,776,773 2,180,701 2,543,909 3,251,125 3,973,246 4,385,039 17,339,027 Forecast of Cash Flows Net Income before Depreciation 112,413 182,460 (339,812) 1,189,413 2,286,369 3,441,012 3,933,181 4,885,434 5,801,021 6,297,791 27,789,282 Deduct startup costs - - - - - - - - - - - Cash flow before income taxes 112,413 182,460 (339,812) 1,189,413 2,286,369 3,441,012 3,933,181 4,885,434 5,801,021 6,297,791 27,789,282 Working Capital - - - - - - - - - - - Lease Payments - Principal 155,146 303,919 401,132 426,689 466,715 510,496 558,384 370,759 149,371 7,389 3,350,001 Pre-Tax Cash Flow (42,733) (121,460) (740,944) 762,725 1,819,654 2,930,516 3,374,796 4,514,674 5,651,651 6,290,402 24,439,282 Taxes - - - - 99,961 934,586 1,090,247 1,393,339 1,702,820 1,879,302 7,100,255 After tax - Cash Flow (42,733) (121,460) (740,944) 762,725 1,719,693 1,995,930 2,284,549 3,121,335 3,948,831 4,411,100 17,339,027
ZXY Company is a food product company. ZXY is considering expanding to two new products and a second production facility. The food products are staples with steady demands. The proposed expansion will require an investment of $7,000,000 for equipment with an assumed ten-year life, after which all equipment and other assets can be sold for an estimated $1,000,000. They will be renting the facility. ZXY requires a 12 percent return on investments. You have been asked to recommend whether or not to make the investment.
In preparing and supporting your recommendation to either make the investment or not, include the following items as part of your analysis:
Analysis of financial information.
Identification of risks associated with the investment. Consider:
How risky the project appears.
How far off your estimates of revenues and expenses can be before your decision would change.
The difference if the company were to use a straight line versus a MACRS depreciation.
Recommendation for a course of action.
Explanation of criteria supporting your recommendation
FINANCIAL STATEMENTS
| ZXY - Forecast | |||||||||||
| Ten Years | |||||||||||
| Pro-Forma Income Statement | Year 1 | Year 2 | Year 3 | Year 4 | Year 5 | Year 6 | Year 7 | Year 8 | Year 9 | Year 10 | Total |
| Brand new Acme System - full system | |||||||||||
| Income | |||||||||||
| Revenue | |||||||||||
| Product A | 2,400,000 | 2,800,000 | 2,800,000 | 3,240,000 | 3,900,000 | 3,900,000 | 3,900,000 | 3,900,000 | 3,900,000 | 3,900,000 | 34,640,000 |
| Product B | 900,000 | 1,350,000 | 2,500,000 | 3,000,000 | 4,000,000 | 4,950,000 | 5,500,000 | 22,200,000 | |||
| Total · Revenue | 2,400,000 | 2,800,000 | 2,800,000 | 4,140,000 | 5,250,000 | 6,400,000 | 6,900,000 | 7,900,000 | 8,850,000 | 9,400,000 | 56,840,000 |
| Cost of Goods Sold | |||||||||||
| Pest Control | 50,000 | 66,550 | 73,205 | 73,205 | 73,205 | 73,205 | 73,205 | 73,205 | 73,205 | 73,205 | 702,190 |
| SQF FDA mandates | 90,000 | 90,000 | 90,000 | 90,000 | 90,000 | 30,000 | 30,000 | 30,000 | 30,000 | 30,000 | 600,000 |
| Rent - Plant | 400,000 | 408,000 | 416,160 | 424,483 | 432,973 | 441,632 | 450,465 | 459,474 | 468,664 | 478,037 | 4,379,888 |
| Plant Equip. - Fklf - Scrb/Lease | 40,000 | 64,000 | 64,000 | 64,000 | 64,000 | 64,000 | 64,000 | 64,000 | 64,000 | 64,000 | 616,000 |
| Plant Equip. - Ongoing maintenance | 50,000 | 70,000 | 75,000 | 75,000 | 75,000 | 75,000 | 75,000 | 75,000 | 75,000 | 75,000 | 720,000 |
| Plant Equip. - Parts | 40,000 | 50,000 | 50,000 | 50,000 | 50,000 | 50,000 | 50,000 | 50,000 | 50,000 | 50,000 | 490,000 |
| Miscellaneous - Equipment | 15,000 | 15,000 | 15,000 | 15,000 | 15,000 | 15,000 | 15,000 | 15,000 | 15,000 | 15,000 | 150,000 |
| Building repairs | 25,000 | 25,000 | 25,000 | 25,000 | 25,000 | 25,000 | 25,000 | 25,000 | 25,000 | 25,000 | 250,000 |
| Plant supplies | 100,000 | 120,000 | 144,000 | 109,808 | 120,789 | 132,868 | 146,154 | 160,770 | 176,847 | 194,532 | 1,405,767 |
| Plant Utilities | 120,000 | 210,000 | 240,000 | 240,000 | 240,000 | 240,000 | 240,000 | 240,000 | 240,000 | 240,000 | 2,250,000 |
| Garbage removal/Janitorial | 30,000 | 45,626 | 52,470 | 52,470 | 52,470 | 52,470 | 52,470 | 52,470 | 52,470 | 52,470 | 495,388 |
| Plant telephone | 7,200 | 7,200 | 7,200 | 7,200 | 7,200 | 7,200 | 7,200 | 7,200 | 7,200 | 7,200 | 72,000 |
| Plant payroll expense | 495,000 | 675,000 | 825,000 | 885,000 | 915,000 | 975,000 | 1,005,000 | 1,065,000 | 1,095,000 | 1,125,000 | 9,060,000 |
| Health Benefits | 45,360 | 97,200 | 105,000 | 100,000 | 100,000 | 100,000 | 100,000 | 100,000 | 100,000 | 100,000 | 947,560 |
| WC & P/R Expense | 59,400 | 81,000 | 99,000 | 106,200 | 109,800 | 117,000 | 120,600 | 127,800 | 131,400 | 135,000 | 1,087,200 |
| Installation/Additional Equipment | 250,000 | - | 200,000 | - | - | - | - | - | - | - | 450,000 |
| Total COGS | 1,816,960 | 2,024,576 | 2,481,035 | 2,317,366 | 2,370,437 | 2,398,375 | 2,454,095 | 2,544,919 | 2,603,786 | 2,664,444 | 23,675,993 |
| Gross Profit | 583,040 | 775,424 | 318,965 | 1,822,634 | 2,879,563 | 4,001,625 | 4,445,905 | 5,355,081 | 6,246,214 | 6,735,556 | 33,164,007 |
| Expenses Other than GOGS | |||||||||||
| Liability Insurance | 60,000 | 91,253 | 104,940 | 104,940 | 104,940 | 104,940 | 104,940 | 104,940 | 104,940 | 104,940 | 990,776 |
| Bank Service Charges | 1,500 | 1,500 | 1,500 | 1,500 | 1,500 | 1,500 | 1,500 | 1,500 | 1,500 | 1,500 | 15,000 |
| Interest on debt | 90,627 | 187,626 | 232,323 | 206,766 | 166,740 | 122,959 | 75,071 | 31,993 | 7,539 | 111 | 1,121,754 |
| Incentive Plan | 13,200 | 16,500 | 16,500 | 16,500 | 16,500 | 16,500 | 16,500 | 16,500 | 16,500 | 145,200 | |
| Management | 180,000 | 180,000 | 180,000 | 180,000 | 180,000 | 190,000 | 190,000 | 190,000 | 190,000 | 190,000 | 1,850,000 |
| Workers Comp./P/R Taxes | 21,600 | 21,600 | 21,600 | 21,600 | 21,600 | 22,800 | 22,800 | 22,800 | 22,800 | 22,800 | 222,000 |
| Health Insurance Benefit | 4,200 | 5,082 | 5,590 | 5,590 | 5,590 | 5,590 | 5,590 | 5,590 | 5,590 | 5,590 | 54,004 |
| Office/Administrative Expenses | 12,000 | 15,972 | 17,569 | 17,569 | 17,569 | 17,569 | 17,569 | 17,569 | 17,569 | 17,569 | 168,526 |
| Legal and Professional - Tax | 30,000 | 10,000 | 10,000 | 10,000 | 10,000 | 10,000 | 10,000 | 10,000 | 10,000 | 10,000 | 120,000 |
| Cellular phones | 5,000 | 5,000 | 5,000 | 5,000 | 5,000 | 5,000 | 5,000 | 5,000 | 5,000 | 5,000 | 50,000 |
| Internet Services | 4,400 | 5,856 | 6,442 | 6,442 | 6,442 | 6,442 | 6,442 | 6,442 | 6,442 | 6,442 | 61,793 |
| Postage & Delivery | 1,100 | 1,464 | 1,611 | 1,611 | 1,611 | 1,611 | 1,611 | 1,611 | 1,611 | 1,611 | 15,448 |
| Office supplies | 11,000 | 9,983 | 10,981 | 10,981 | 10,981 | 10,981 | 10,981 | 10,981 | 10,981 | 10,981 | 108,829 |
| Employee Food & Beverage | 1,100 | 1,464 | 1,611 | 1,611 | 1,611 | 1,611 | 1,611 | 1,611 | 1,611 | 1,611 | 15,448 |
| Local/Business Taxes | 1,100 | 1,464 | 1,611 | 1,611 | 1,611 | 1,611 | 1,611 | 1,611 | 1,611 | 1,611 | 15,448 |
| Property Taxes | 12,000 | 15,000 | 15,000 | 15,000 | 15,000 | 15,000 | 15,000 | 15,000 | 15,000 | 15,000 | 147,000 |
| Travel - Equip. Consultants | 25,000 | 16,500 | 16,500 | 16,500 | 16,500 | 16,500 | 16,500 | 16,500 | 16,500 | 16,500 | 173,500 |
| Licenses and Permits | 10,000 | 10,000 | 10,000 | 10,000 | 10,000 | 10,000 | 10,000 | 10,000 | 10,000 | 10,000 | 100,000 |
| Total Expense | 470,627 | 592,964 | 658,777 | 633,220 | 593,194 | 560,613 | 512,725 | 469,647 | 445,193 | 437,765 | 5,374,724 |
| Net Income before Depreciation | 112,413 | 182,460 | (339,812) | 1,189,413 | 2,286,369 | 3,441,012 | 3,933,181 | 4,885,434 | 5,801,021 | 6,297,791 | 27,789,282 |
| Depreciation Expense ( | 185,770 | 504,140 | 652,915 | 573,415 | 409,635 | 325,725 | 299,025 | 240,970 | 124,955 | 33,450 | 3,350,000 |
| Tax Expense | - | - | - | - | 99,961 | 934,586 | 1,090,247 | 1,393,339 | 1,702,820 | 1,879,302 | 7,100,255 |
| Net Income | (73,357) | (321,680) | (992,727) | 615,998 | 1,776,773 | 2,180,701 | 2,543,909 | 3,251,125 | 3,973,246 | 4,385,039 | 17,339,027 |
| Forecast of Cash Flows | |||||||||||
| Net Income before Depreciation | 112,413 | 182,460 | (339,812) | 1,189,413 | 2,286,369 | 3,441,012 | 3,933,181 | 4,885,434 | 5,801,021 | 6,297,791 | 27,789,282 |
| Deduct startup costs | - | - | - | - | - | - | - | - | - | - | - |
| Cash flow before income taxes | 112,413 | 182,460 | (339,812) | 1,189,413 | 2,286,369 | 3,441,012 | 3,933,181 | 4,885,434 | 5,801,021 | 6,297,791 | 27,789,282 |
| Working Capital | - | - | - | - | - | - | - | - | - | - | - |
| Lease Payments - Principal | 155,146 | 303,919 | 401,132 | 426,689 | 466,715 | 510,496 | 558,384 | 370,759 | 149,371 | 7,389 | 3,350,001 |
| Pre-Tax Cash Flow | (42,733) | (121,460) | (740,944) | 762,725 | 1,819,654 | 2,930,516 | 3,374,796 | 4,514,674 | 5,651,651 | 6,290,402 | 24,439,282 |
| Taxes | - | - | - | - | 99,961 | 934,586 | 1,090,247 | 1,393,339 | 1,702,820 | 1,879,302 | 7,100,255 |
| After tax - Cash Flow | (42,733) | (121,460) | (740,944) | 762,725 | 1,719,693 | 1,995,930 | 2,284,549 | 3,121,335 | 3,948,831 | 4,411,100 | 17,339,027 |

Related questions

Presto! Inc. is a wholesale distributor supplying a wide range of moderately priced cooking equipment to large chain stores. Presto! has an enviable reputation for quality of its products. With the explosion of the healthy eating and organic phenomenon and the current open concept in housing, there is a significant uptick in the âat home foodieâ. In fact, the demand for Presto!âs products is so great that at times Presto! cannot satisfy the demand and must delay or refuse some orders, in order to maintain its production quality. Additionally, Presto! purchases some of its products from outside suppliers in order to meet the demand. These suppliers are carefully chosen so that their products maintain the quality image that Presto! has attained. About 60 percent of Presto!'s products are purchased from other companies while the remainder of the products are manufactured by Presto!.
The company has a Metals Department that is currently manufacturing the pans for the cooking set. Presto! is able to manufacture and sell 15,000 sets of pans annually, making full use of its machine capacity at available workstations. Presented below are the selling price and costs associated with Presto!'s cooking pans.
| Selling Price per set | $250 | |
| Cost Per set: | ||
| Molded Plastic | $25 | |
| Aluminum | $75 | |
| Machine time ($16/hr) | $24 | |
| Manufacturing overhead | $18 | |
| Selling and admin. cost | 15 | $157 |
| Profit per set of pans | $93 |
Because Presto! believes it could sell 24,000 sets of pans annually if it had sufficient manufacturing capacity, the company has looked into the possibility of purchasing the pans for distribution. HotStuff Inc., a steady supplier of quality products, would be able to provide 18,000 sets of pans per year at a price of $175 per set delivered to Presto!'s facility.
Jack Petrone, Presto!'s product manager, has suggested that the company could make better use of its Metals Department by manufacturing high-end cutlery. To support his position, Petrone has a market study that indicates an expanding market for high-end cutlery and a need for additional suppliers. Petrone believes that Presto! could expect to sell 36,000 sets of high-end cutlery annually at a price of $260 per set. Petrone's estimate of the costs to manufacture the cutlery is presented below.
High-End Cutlery data
| Selling Price per set: | $260 | |
| Cost per set: | ||
| Molded Plastic | $25 | |
| Carbon Steel | $175 | |
| Machine Time ($16/hr) | $8 | |
| Manufacturing overhead | $6 | |
| Selling and admin. cost | $14 | $228 |
| Profit per set of pans | $32 |
Other information pertinent to Presto!'s operations is presented below.
An allocated $6 fixed overhead cost per unit is included in the selling and administrative cost for all of the purchased and manufactured products. Total fixed and variable selling and administrative costs for the purchased pans would be $10 per set.
In the Metals Department, Presto! uses machine hours as the application base for manufacturing overhead. Included in the manufacturing overhead for the current year is $90,000 of fixed, factory-wide manufacturing overhead that has been allocated to the Metals Department.
REQUIRED: To maximize Presto! Inc.'s profitability, recommend which product or products should be manufactured and/or purchased. This recommendation should be supported by an analysis based on the data presented that will show the associated financial impact. (This means compare the current product manufacturing decision with your proposed decision). Support your answer with appropriate calculations and strategic considerations. Hint: The first step is to separate all costs into their respective fixed and variable components.