1
answer
0
watching
425
views
10 Nov 2019
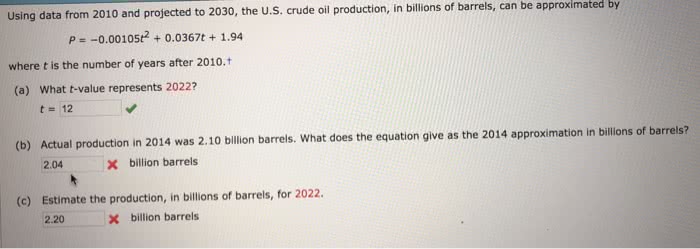
Using data from 2010 and pro jected to 2030, the U.S. crude oil production, in billions of barrels, can be approximated by P0.00105t2+0.03671.94 where t is the number of years after 2010.t (a) What t-value represents 20221? t 12 (b) Actual production in 2014 was 2.10 billion barrels. What does the equation give as the 2014 approximation in billions of barrels? 2.04 X billion barrels (c) Estimate the production, in billions of barrels, for 2022. 2.20 X billion barrels
1
answer
0
watching
425
views
For unlimited access to Homework Help, a Homework+ subscription is required.
Jamar FerryLv2
10 Nov 2019