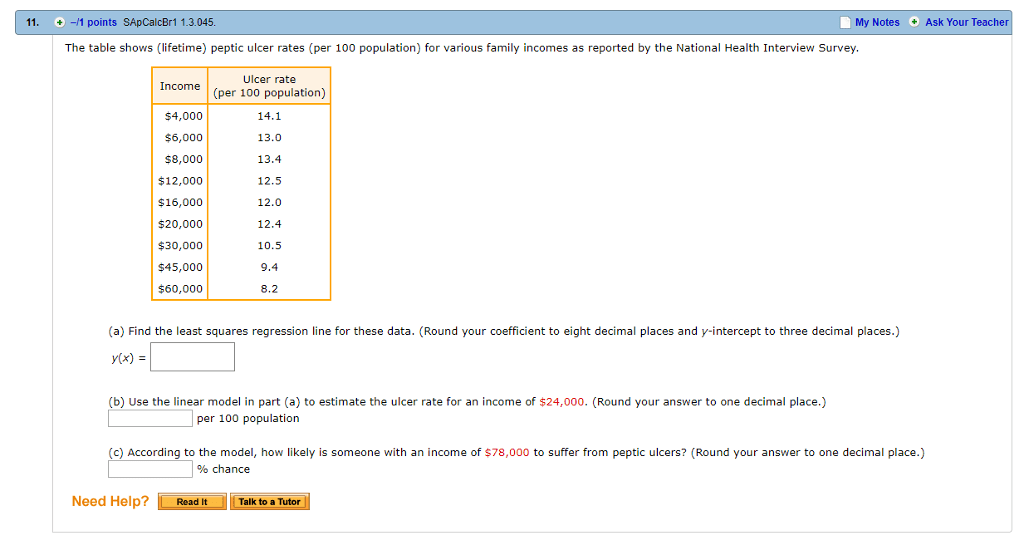
The table shows (lifetime) peptic ulcer rates (per 100 population) for various family incomes as reported by the National Health Interview Survey.
(a) Find the least squares regression line for these data.
(b) Use the linear model in part (a) to estimate the ulcer rate for an income of $24,000.
(c) According to the model, how likely is someone with an income of $78,000 to suffer from peptic ulcers?
11. +-/1 points SApCalcBr1 1.3.045 My Notes Ask Your Teac The table shows (lifetime) peptic ulcer rates (per 100 population) for various family incomes as reported by the National Health Interview Survey Ulcer rate Income (per 100 population) $4,000 $6,000 $8,000 $12,000 $16,000 $20,000 $30,000 $45,000 $60,000 14.1 13.0 13.4 12.5 12.0 12.4 10.5 9.4 8.2 (a) Find the least squares regression line for these data. (Round your coefficient to eight decimal places and y-intercept to three decimal places.) y(x) = (b) Use the linear model in part (a) to estimate the ulcer rate for an income of $24,000. (Round your answer to one decimal place.) per 100 population (c) According to the model, how likely is someone with an income of $78,000 to suffer from peptic ulcers? (Round your answer to one decimal place.) % chance Need Help? Read It Talk to a Tutor