1
answer
0
watching
105
views
10 Nov 2019
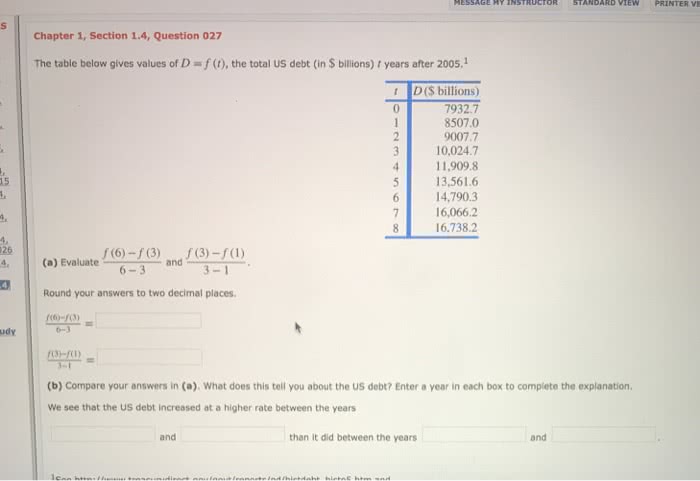
EW PRINTER VE Chapter 1, Section 1.4, Question 027 The table below gives values of D f (t), the total US debt (in $ billions) / years after 2005. D (S billions) 7932.7 8507.0 9007.7 10,024.7 11,909.8 5 13,561.6 14,790.3 7 16,066.2 16,738.2 15 4. (a) Evaluate o)-0 and 6-3 Round your answers to two decimal places. udy 6-3 (b) Compare your answers in (a). What does this tell you about the US debt? Enter a year in each box to complete the explanation We see that the US debt increased at a higher rate between the years and than it did between the years and
Elin HesselLv2
18 May 2019