1
answer
0
watching
50
views
10 Nov 2019
The First Question was to create a scatter plot of thistable.
Hourly Rate ($) Weekly Earnings ($)
10 700
25 1450
45 1890
65 1690
90 540
I have done that here :
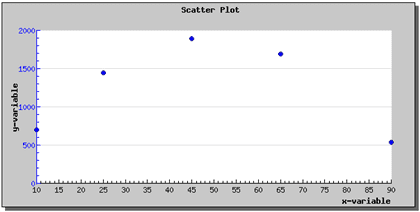
The next question is to determine the equation for the parabolaof best fir for the data. Round the numbers in your equation to onedecimal place.
But i have no idea how to do this... if somebody could help meplease.

Hubert KochLv2
31 Jan 2019