1
answer
1
watching
187
views
12 Nov 2019
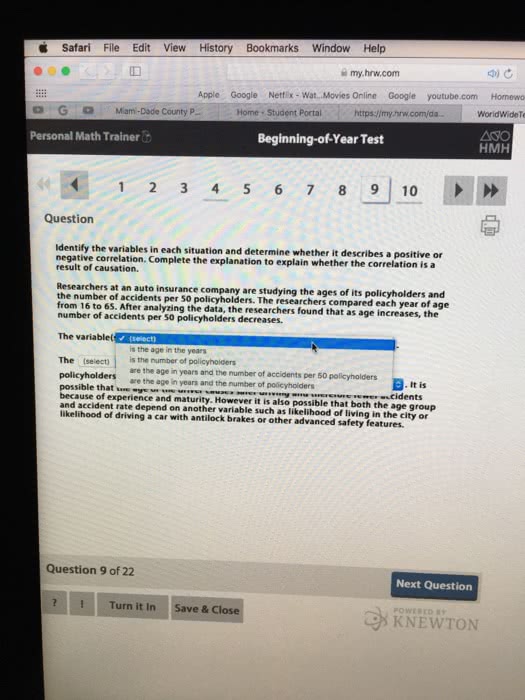
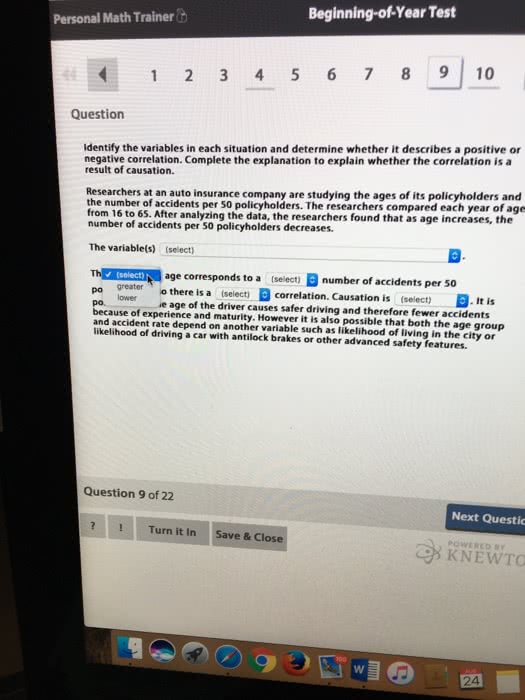
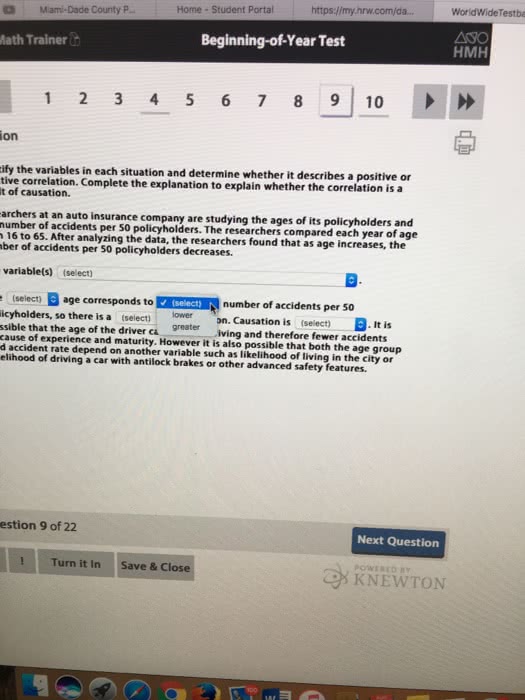
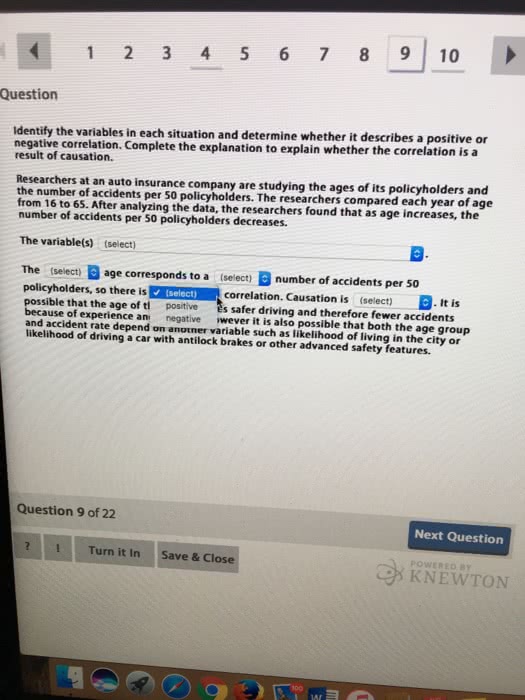
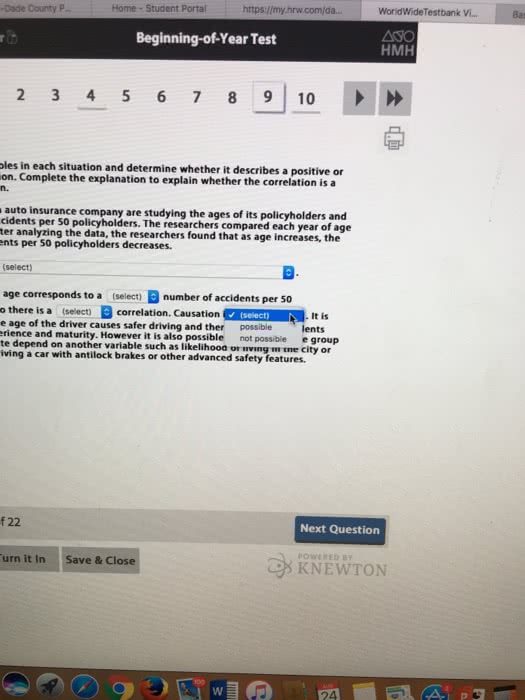
Safari File Edit View History Bookmarks Window Help my.hrw.com Netfx-Wat...Movies Online Google youtube.com Homewo https://my.hrw.com/da. Apple Google o G o Miami-Dade County P Home Student Portal Personal Math Trainer Beginning-of-Year Test HMH 123456789|10 >» Question dentify the variables in each situation and determine whether it describes a positive or negative correlation. Complete the explanation to explain whether the correlation is a result of causation. policyholders and Researchers at an auto insurance company are studying the ages of its the number of accidents per S50 policyholders. The researchers compared each year of age from 16 to 65. After analyzing the data, the researchers found that as age increases, the number of accidents per S0 policyholders decreases. The variablet The (select policyholders is the age in the years is the number of policyholders are the age in years and the number of accidents per 50 policyholders are the age in years and the number of policyholders It is e cidents ause of experience and maturity. However it is also possible that both the age group likelihood of driving a car with antilock brakes or other advanced safety features. and accident rate depend on another variable such as likelihood of living in the city or Question 9 of 22 Next Question 2!Turn t In Save&Close POWERED BY KNEWTON
Jean KeelingLv2
19 Jul 2019