1
answer
0
watching
181
views
12 Nov 2019
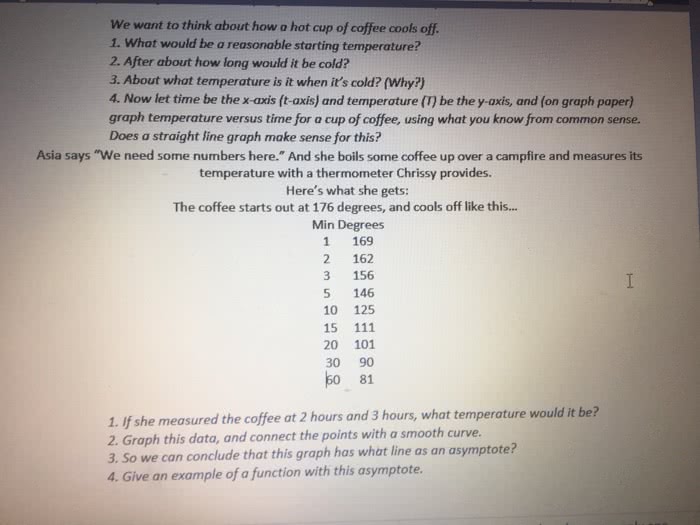
We want to think about how o hot cup of coffee cools off. What would be a reasonable starting temperature? After about how long would it be cold? About what temperature is it when it's cold? (Why?) Now let time be the x-axis (t-axis) and temperature (T) be the y-axis, and (on graph paper) graph temperature versus time for a cup of coffee, using what you know from common sense. Does a straight line graph make sense for this? Asia says "We need some numbers here." And she boils some coffee up over a campfire and measures its temperature with a thermometer Chrissy provides. Here's what she gets: The coffee starts out at 176 degrees, and cools off like this... If she measured the coffee at 2 hours and 3 hours, what temperature would it be? Graph this data, and connect the points with a smooth curve. So we can conclude that this graph has what line as an asymptote? Give an example of a function with this asymptote.
Irving HeathcoteLv2
27 Aug 2019