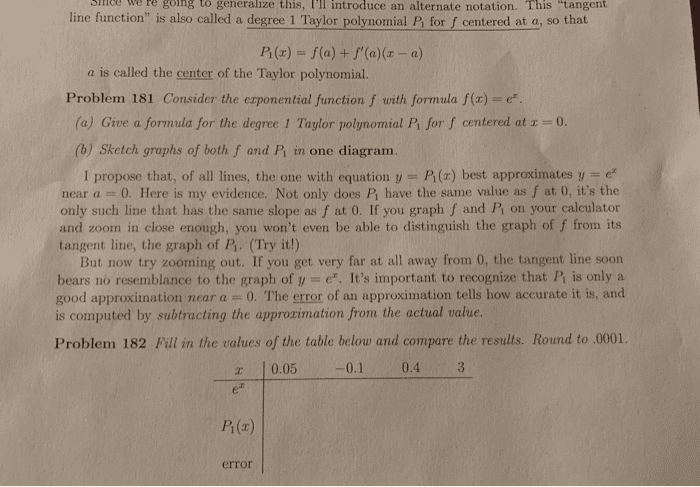
nce we re going to generalize this, I'll introduce an alternate notation. This "tangent line function" is also called a degree 1 Taylor polynomial Pr for f centered at a, so that a is called the center of the Taylor polynomial. Problem 181 Consider the exponential function f with formula f(x)-e" (a) Give a formula for the degree 1 Taylor polynomial P for f centered atã§= 0. (b) Sketch graphs of both f and P in one diagram. I propose that, of all lines, the one with equation y P(a) best approximates y e near a - 0. Here is my evidence. Not only does Pi have the same value as f at 0, it's the only such line that has the same slope as f at 0. If you graph f and Pi on your calculator and zoom in close enough, you won't even be able to distinguish the graph of f from its tangent line, the graph of P. (Try it!) But now try zooming out. If you get very far at all away from 0, the tangent line soon bears no resemblance to the graph of y-e. It's important to recognize that P is only a good approximation near a 0. The error of an approximation tells how accurate it is, and is computed by subtracting the approzimation from the actual value. Problem 182 Fill in the values of the table below and compare the results. Round to 0001. x 10.05-0.1 er 0.4 P (r) error
Show transcribed image textnce we re going to generalize this, I'll introduce an alternate notation. This "tangent line function" is also called a degree 1 Taylor polynomial Pr for f centered at a, so that a is called the center of the Taylor polynomial. Problem 181 Consider the exponential function f with formula f(x)-e" (a) Give a formula for the degree 1 Taylor polynomial P for f centered atã§= 0. (b) Sketch graphs of both f and P in one diagram. I propose that, of all lines, the one with equation y P(a) best approximates y e near a - 0. Here is my evidence. Not only does Pi have the same value as f at 0, it's the only such line that has the same slope as f at 0. If you graph f and Pi on your calculator and zoom in close enough, you won't even be able to distinguish the graph of f from its tangent line, the graph of P. (Try it!) But now try zooming out. If you get very far at all away from 0, the tangent line soon bears no resemblance to the graph of y-e. It's important to recognize that P is only a good approximation near a 0. The error of an approximation tells how accurate it is, and is computed by subtracting the approzimation from the actual value. Problem 182 Fill in the values of the table below and compare the results. Round to 0001. x 10.05-0.1 er 0.4 P (r) error